3.1) Data Modelling
Hello readers, we have begun with week 3 tasks of Hasura internship. This week we will be covering Data Modelling part of our project. The tasks for this week includes creating a schema model, using Hasura Data APIs and using Hasura Auth APIs. For this post we focus on the schema model of our project.
You can have a look at our Three screen app idea. Also refer to this prototype blog App Wireframe/Prototype.
Schema Diagram

For this task, we were recommended to use PonyORM. People at Hasura always seem to find the right tool for the right task! Now, PonyORM is a very intuitive tool to build your schema. It includes a drag and drop interface along with a simple way to add attributes to your tables. For each attribute, one can specify its type. It also allows you to define relationships between different tables.
For our app we required three tables a user_info table, a category table and an expense table which covered all the data required for our three screen app.
The user_info table stores user related info which includes user_id and user’s name. The category table stores category information such as category_id and category_name. The final table is expense table which stores all the expense related details. It includes exp_id, user_id to refer to the user_info table, exp_name to store expense name, exp_amt for the expense amount, exp_created stores the timestamp at which expense was created, exp_category refers to category table, exp_note for adding any note and exp_tag to add tags related to the expense.
Two views have been also included in the schema diagram which are Expense_info and Statistics.
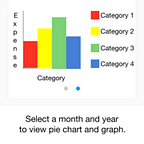
Expense_info is a view which is generated from expense table. It consists of the attributes which are required to display an expense. Another view is statistics which is also based on the expense table. This view is used to fetch the required data to display statistics in an appropriate form like a pie chart or a bar graph.
The next blog post includes details about using Hasura Data APIs and Postman collection.
-Akash Dabhi and Vinit Neogi