The Geometry of Scarcity: Decoding the 2028 Bitcoin Halving and the Evolution of Digital Hard Money

Introduction: Seeking Signal in an Age of Noise
In the traditional financial theater, we are accustomed to the “calculated ambiguity” of central banks and the constant revisions of economic data. However, deep within the architecture of the Bitcoin protocol lies a monetary policy of absolute certainty — the Bitcoin Halving.
As the dust settles from the 2024 event, the global gaze is already shifting toward 2028. When block rewards drop from 3.125 BTC to 1.5625 BTC, it marks more than a mere supply cut; it is the ultimate stress test for Bitcoin as a “Hard Money” asset.
Get Bitcoin’s stories in your inbox
Join Medium for free to get updates from this writer.
For those who demand objective truth over market sentiment, btbjb.com has emerged as a critical observation deck. It is not just a countdown timer; it is a platform that fuses Full Historical Price Action with Bitcoin Halving Nodes to provide a definitive coordinate system for the future.
If you’re not familiar with how Bitcoin halving works, please refer to the documentation:
https://github.com/CryptoTag/bitcoin-halving-data
I. Dynamic Precision: When Code Dictates Time
Most people believe the halving occurs strictly every four years. This is a common simplification.
1.1 Block Height vs. The Gregorian Calendar
The Bitcoin Halving is triggered by the completion of 210,000 blocks, not a calendar date. This means the actual moment depends on the network’s total Hashrate and the Difficulty Adjustment.

On the btbjb.com homepage, you will find a live, algorithm-driven clock. Unlike static counters, btbjb’s engine monitors real-time block production speeds. If global mining power surges, the countdown accelerates. This on-chain predictive accuracy allows researchers to capture the rhythmic pulse of the global mining industry as it influences the next halving event.
II. Historical Node Analysis: The Wealth Logic on the Axis
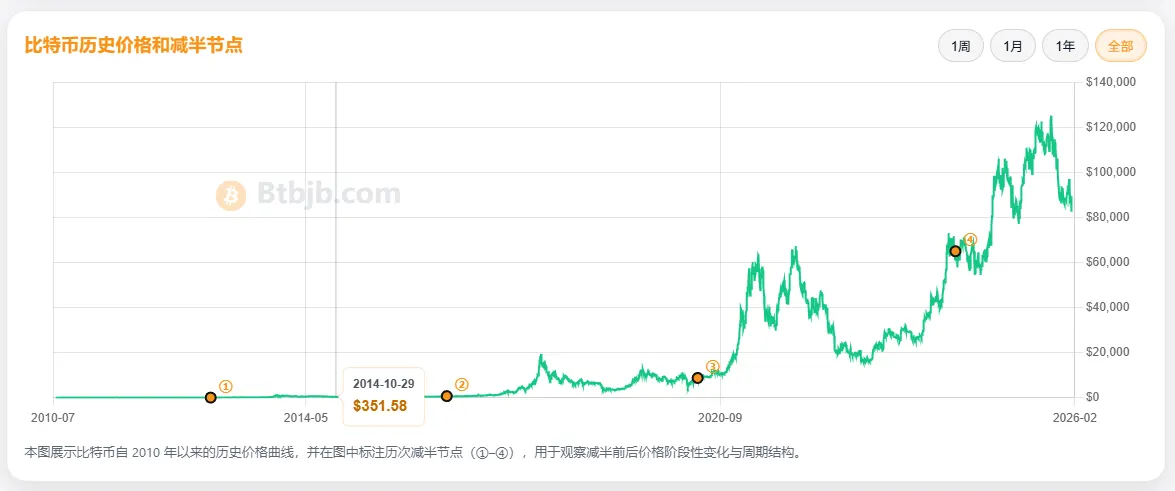
The soul of btbjb is its Interactive Historical Price & Halving Node Chart.

2.1 The Mirror of Cycles
Opening this interactive map reveals a complete historical mirror of the Bitcoin network. The platform meticulously anchors the 2012, 2016, 2020, and 2024 halving nodes directly onto the price curve.
- The 2012 Node: When Bitcoin was a niche cypherpunk experiment.
- The 2016 Node: The era of the ICO boom and the birth of Ethereum.
- The 2020 Node: The entry of institutions like MicroStrategy and the rise of the “Digital Gold” narrative.
- The 2024 Node: Major institutions, including BlackRock, began accumulating Bitcoin.
Using btbjb’s scaling and comparison features, users can identify a startling consistency: every halving node serves as a structural “booster” for the long-term price trajectory.
2.2 Cycle Overlay: History Rhymes
The platform allows users to overlay the current 2028 cycle with any previous epoch. This visualization shatters “survivorship bias” — it shows not just the parabolic rallies, but also the months of grueling consolidation and uncertainty that inevitably follow each halving.
III. Quantifying the Supply Shock: The Post-Halving Return Model
The idea that “Halving equals an instant moonshot” is one of the greatest misconceptions in the crypto space.
3.1 The Lag Effect
btbjb’s proprietary Post-Halving N-Day Return Distribution Chart provides a sobering, rational perspective. By reviewing the data, we see a clear pattern:

- Day 30 Post-Halving: Markets often enter a “cool-down” phase or a “sell the news” correction.
- Day 90–180 Post-Halving: Only as the cumulative effect of reduced supply hits secondary markets does the true supply shock begin to manifest.
This quantitative analysis helps investors mitigate anxiety and cultivate a “low time preference” strategy.
IV. Risk Management: The Historical Mirror of Drawdowns
If you cannot stomach a 30% drawdown, you don’t deserve a 300% gain.
4.1 Unmasking the “Shakeouts”
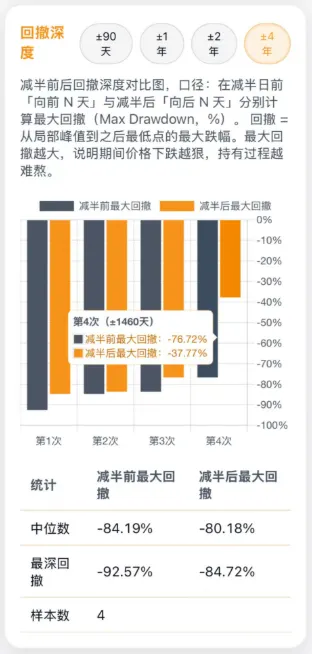
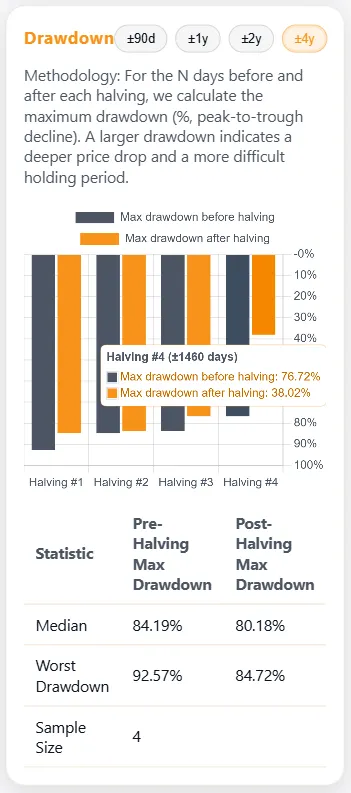
The Pre/Post-Halving Drawdown Comparison Tool is essential for any risk manager.

It visualizes the extreme price corrections that have historically flanked halving nodes. Whether it was the “Black Thursday” crash before the 2020 halving or the deep corrections of 2016, btbjb proves that the path to new highs is never linear. Understanding these “shakeout” depths allows you to build a psychological fortress against the volatility of the 2028 cycle.
V. Behavioral Statistics: Seeking Seasonality in Volatility
Does Bitcoin have a seasonal pulse? While debated, btbjb chooses to let the data speak.
5.1 The Probability Heatmap
By analyzing over a decade of daily price fluctuations, the site identifies historical clusters of strength and weakness throughout the year. While past performance does not guarantee future results, this “Seasonal Probability” provides a unique lens into global liquidity cycles, helping macro traders optimize their risk exposure.

VI. Tactical Utilities: The “Time-to-Green” Metric
Perhaps the most empathetic feature on btbjb is the “Time Required to Reclaim Profit” tool.

Entering at a market peak is a nightmare for many. This tool utilizes historical data to calculate how many days it took — at various entry points — to break even and enter the profit zone. It quantifies “Time” as a fundamental component of the asset, guiding users toward long-term HODLing rather than short-term gambling.
VII. The Macro Anchor: BTC vs. Gold vs. Fiat
Bitcoin’s final evolution is that of a “Hard Money” standard.
7.1 The Step-Down of Inflation
On btbjb’s macro dashboard, you can witness the relentless descent of Bitcoin’s inflation rate.
- Today: BTC’s inflation is already lower than or equal to that of gold.
- Post-2028: As block rewards drop to 1.5625, BTC’s annual issuance rate will be slashed in half again.

The platform allows users to compare Bitcoin, Gold, and the USD in a single purchasing power race. It is a powerful visualization of fiat erosion versus the programmatic scarcity of the Bitcoin network.
Conclusion: Finding Future in Certainty
In a world defined by randomness, the Bitcoin Halving is one of the few global financial events we can predict years in advance. btbjb.com exists to liberate this certainty from the code, transforming it into an interactive, visual journey for the modern researcher.
Whether you are looking to hedge risk, capture upside, or conduct pure economic research, btbjb is your indispensable compass. In this coordinate system, data is the only signal, and history is the best teacher.
Visit btbjb.com today to master the logic of the 2028 Halving.