Vaccination Disparities Across Racial and Ethnic Groups
By Laura Chen & Susan Paykin
New CDC data on COVID-19 vaccination rate shows that many states are still facing significant inequalities in distribution of vaccines across racial and ethnicity groups, with non-white populations disproportionately fewer shots.
The CDC has committed to ensuring equity in its COVID-10 vaccine distribution by targeting those communities most impacted by COVID. To date, more than one third of all adults in the United States have now received their first dose of a COVID-19 vaccine, marking a significant milestone on the path toward achieving herd immunity. Breaking this down further, demographic identifiers such as race or ethnicity can help show how well the CDC has ensured equitable distribution, and where it can do better.
The pandemic has underscored the importance of social determinants of health (SDOH) in our public health responses.
SDOH are the conditions in which people are born, grow, live, work, and age. This includes aspects of the social environment such as discrimination based on race or ethnic identity and are critical for informing effective and equitable health interventions. The CDC has recently started compiling and releasing COVID data based on race and ethnicity which helps us better understand the disproportionate impact on racial and ethnic minority groups, particularly Black, Latino, and Native American communities.
The CDC has released state-level race and ethnicity data on COVID vaccination rates for the entire country. State-level estimates provide limited insight into community-wide experiences. Population and community group sizes and spatial distributions are quite heterogeneous across states, with minority populations often concentrated in cities. The state-wide average from Alabama, for example, may mask the specific issues facing Black communities in Birmingham, or hide the particular barriers for white communities in rural Marshall County. Despite limitations of the low-resolution data, we can start to explore national trends.
According to the CDC, of those who have gotten at least one dose of a vaccine, over 65% identify as White/Non-Hispanic people, compared to Hispanic/Latino (9.5%), American Indian/Alaska Native (1.3%), Asian (5%), Black (8.3%), and multiple or other race or ethnicity groups (9.9%).
The percent of those who are fully vaccinated also follows a similar trend. The chart below shows that of that group, about 69% identify as White, representing a significant majority of the fully vaccinated population.

There is much more to dig into here -- including understanding the proportionate rate at which these groups have been vaccinated and understanding where more effort is needed to ensure the hardest hit communities have access to the vaccines. Still, this initial data showing racial disparities in vaccination is alarming, as Black, Latino, and people of color are more likely to also contract the virus. The issues are structural, and tied to social determinants of health: Many communities of color have high rates of front-line jobs that keep them from working at home; rely on public transportation, or may live in smaller apartments or multigenerational homes.
There are several factors that may explain the uneven distribution of vaccines across racial groups. These communities, which have been historically segregated and systemically underserved, may face a number of issues that hinder their access to vaccines, including online registration systems, a lack of transportation and difficulty getting time off from work.
Similar trends have been reported at the local level. New York City released zip code data which revealed that residents in wealthier, predominantly white neighborhoods, such as the Manhattan’s Upper West Side and Upper East Side, were eight times more likely to be fully vaccinated than residents in predominantly Black neighborhoods, such as East New York, Brooklyn, underscoring that the vaccine is “flowing disproportionately toward areas with wealthy and white residents, even though low-income communities of color remain the hardest hit by the coronavirus.” We have seen similar reports from Chicago, New Jersey, Arizona, and more.
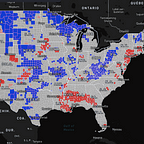
To combat these systematic disparities, local and state officials work to open more vaccination sites and offer services that are readily accessible to non-white communities of color. The Atlas is now offering features that make it easier to find vaccine sites, federal super-sites, and health clinics in your area — see the map below for a sneak peak. You can also check how your state or county compares in vaccinating its residents on the Atlas.
While vaccine distribution continues, case rates have once again been on the rise across many states and counties. Please continue to follow CDC guidelines to stop the spread of COVID-19: wear a mask (better yet, double up), practice social distancing, wash your hands, and stay at home as much as possible.