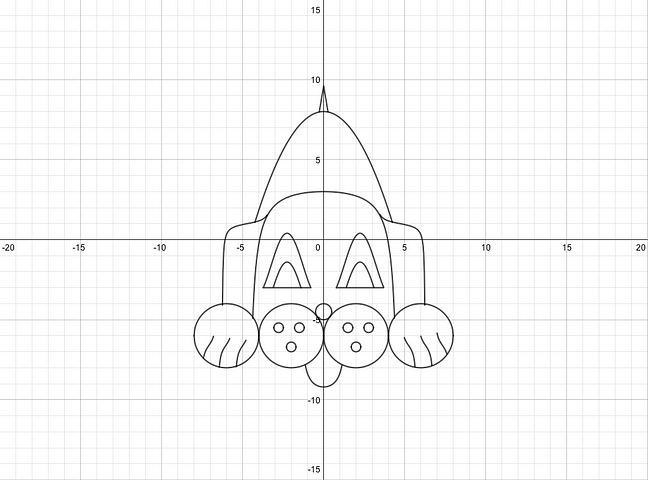
Make no bones about it, the math students at Catawba Valley Community College have created some spooktacular mathterpieces on the Desmos graphing calculator. Who knew graphing functions could be so fang-tastically fun!
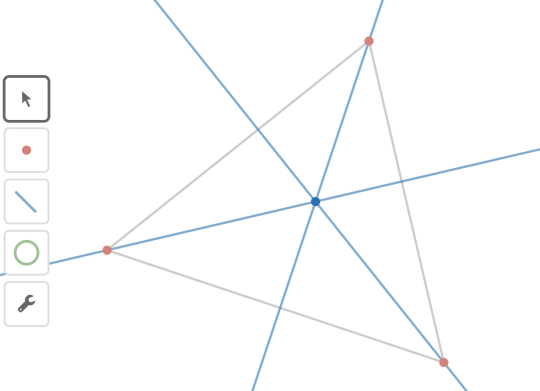
Desmos is proud to announce the beta release of our geometry tool. You can find it at www.desmos.com/geometry.
Our last announcement in this latest round of calculator updates is an overview of how to navigate the improved interface and keypad. Here’s a quick tour from Eli:
This week we asked the Desmos Fellows to find the errors in this five-screen Pythagorean theorem practice activity, where the errors were violations of the Desmos activity building code. The fellows had much to say about each screen in general, and even more to say about the…
We’ve heard you loud and clear. The Desmos colors are good but not great. They just don’t pop.
Over the last few months, our textures team has been sampling textiles from Brooklyn boutiques, haberdasheries, and…
Limiting the domain and range on the Desmos graphing calculator is simple. Once you’ve mastered this feature you’ll be cranking out incredible graph art in no time. Watch this quick tutorial to learn how:
Every day, our users fill our homepage with incredible graphs. Today, we’d like to highlight a few creations that have truly inspired us. First up is Andrea, a high school student from a bilingual school in Guadalajara, Mexico. Her graph is a hoot!
As the number of graphs shared through the Desmos graphing calculator grows, we’re going to start posting our favorites every week. Below is this week’s submission. We call it the bowtie:
Occasionally, we see a graph that just blows us away with its beauty and ingenuity. Like this one:
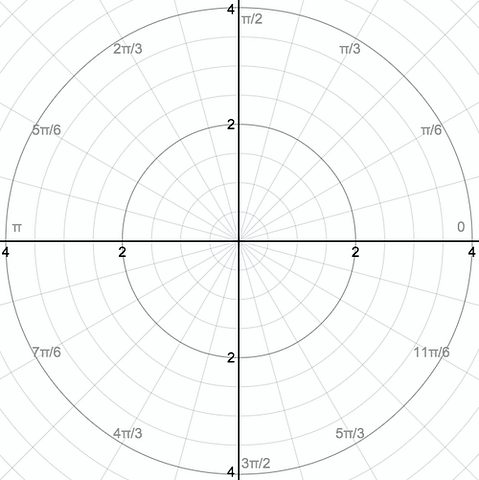
Brrrr! Piping cold out of Desmos Labs: Polar Axes! Although graphing polar functions has been possible since Desmos went…
These were the top 10 stories published by Desmos Blog; you can also dive into yearly archives: 2011, 2012, 2013, 2014, 2015, 2016, and 2017.