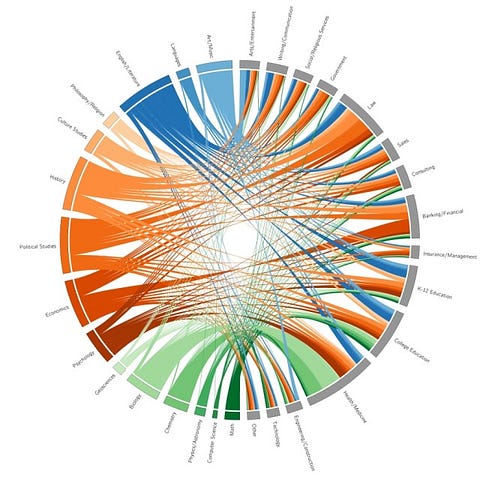
Interactive career data visualization
This is a great interactive data visualization on the ultimate career paths of Williams students. Click through to interact with it!
These were the top 10 stories published by Everything is Everything in 2012. You can also dive into monthly archives for 2012 by using the calendar at the top of this page.