Top Stories published by Indicatrix in 2011

1–2–3: Mirror Modelling in Inkscape

The other day, I needed to draw a symmetrical object (a map point icon) in Inkscape, the wonderful free vector graphics editor. I was surprised to find that there is no symmetrical modeling feature, so I improvised. Here’s how to create a symmetrical polygon in…

Accessing GTFS Data in QGIS

When you load GTFS data into PostGIS using gtfsdb, you can’t access that data in QGIS because the tables don’t have a primary key in int4 format (the primary key is in text format).


GTFSrDB: Plumbing for GTFS-realtime

Over the last week I’ve started a new project, GTFSrDB, which allows you to connect GTFS-realtime with an SQL database, allowing app developers to use realtime data through SQL, just as easily as they use static data. Rather than worry about plumbing to connect GTFS…


Agencies Providing Real-Time Data

Note 2012–06–15: this page is now quite outdated.

As a part of the Transit Appliance Project, I’ve been evaluating what transit agencies have real-time data; here’s a (non-exhaustive) list, focused primarily on U.S. agencies (note: these are…


Basemaps in QGIS

Update 2012–02–02 17:57 -0800:I just wrote a post about another way to do this.

I really like QGIS. It’s a powerful GIS that runs on Linux (among other operating systems) and doesn’t require incredible amounts of CPU. One criticism I had of it was that it did not provide…


Archiving Historical Data from NextBus

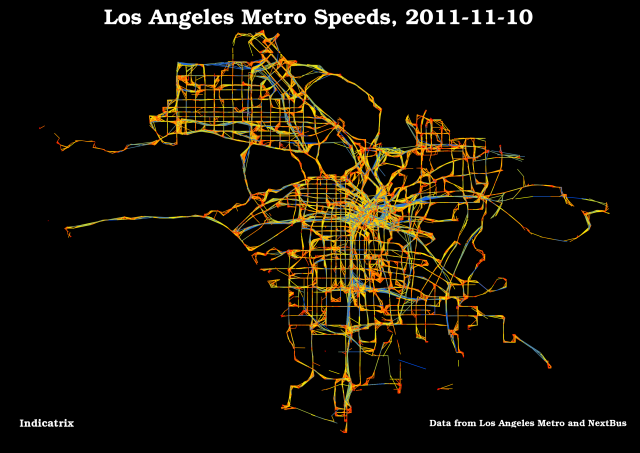
It seems that everyone who analyzes historical NextBus data has a different way of archiving their data. There are lots of ways one can use GIS to analyze this data, from creating movies showing the pulse of the transit system, to analyzing on-time performance…

These were the top 10 stories published by Indicatrix in 2011. You can also dive into monthly archives for 2011 by using the calendar at the top of this page.

About
Indicatrix
I’m a PhD student in geography studying urban transportation at Arizona State.
More information
Editors