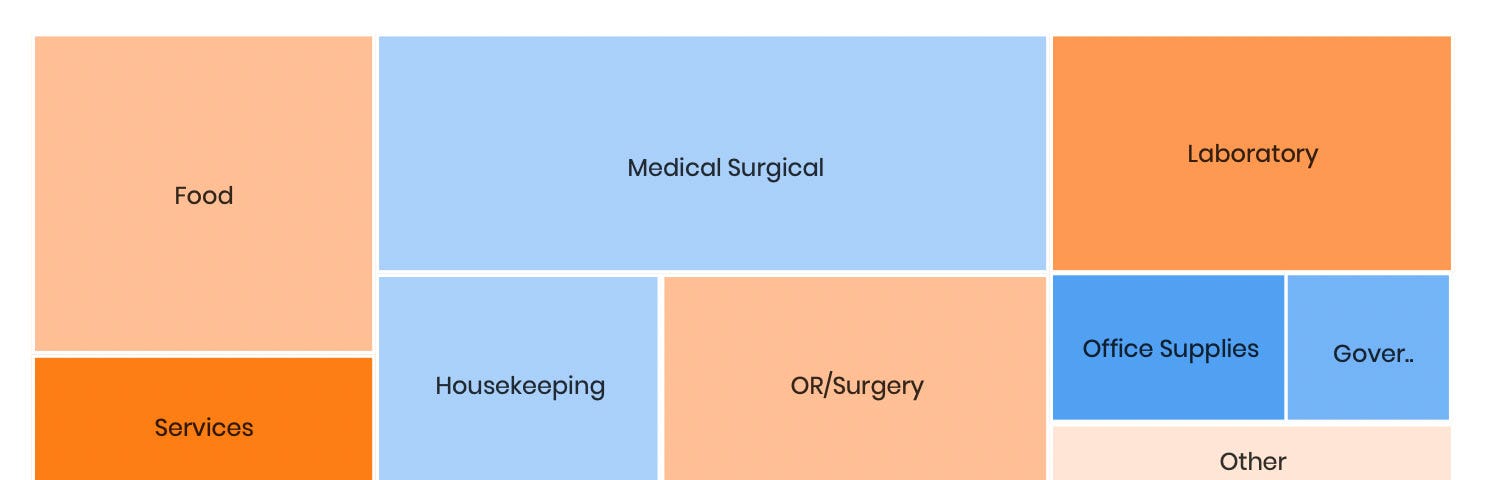
The following heat map displays how value of spend for certain categories changed over two period of times.