Homepage
Open in app
Sign in
Get started
All stories
How To & Career
Historic Data Viz
We moved to: https://nightingaledvs.com
Tagged in
Data Science
Nightingale
We moved to
https://nightingaledvs.com
!
More information
Followers
16.6K
Elsewhere
More, on Medium
Data Science
Jason Forrest
in
Nightingale
Jun 28, 2019
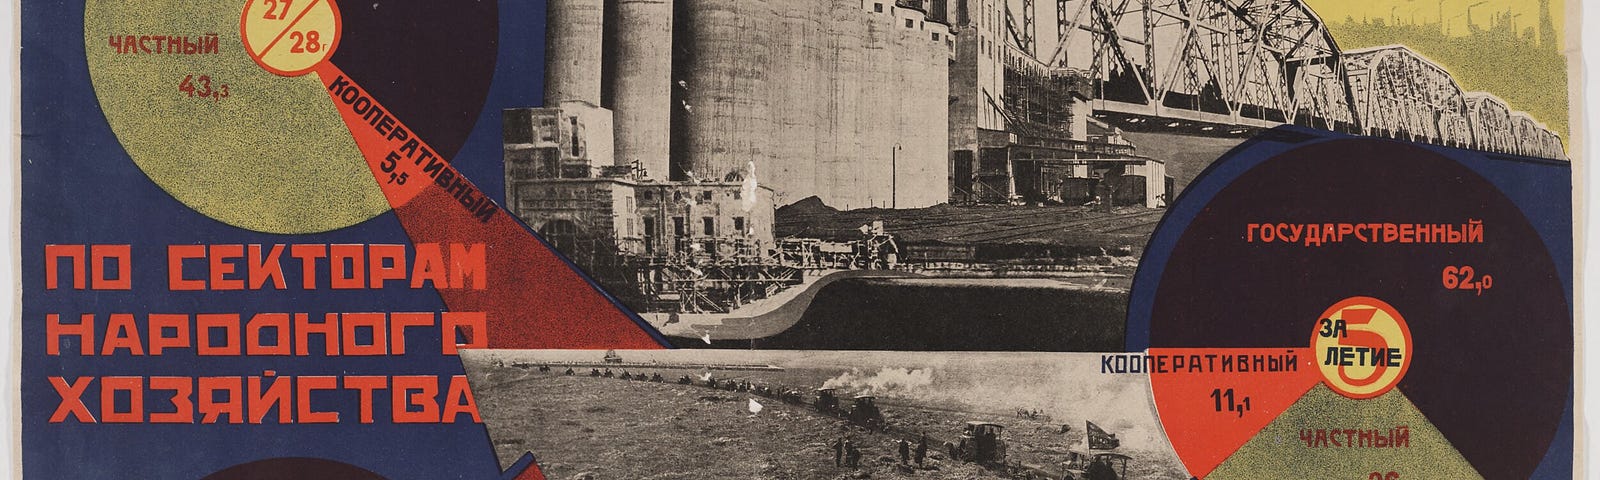
Data Visualization in the Age of Communism
The Soviet Union used data to inspire, terrify, and…
Read more…
1.5K
2 responses
Mary Aviles
in
Nightingale
Oct 5, 2021
Print subscription starts today!
Visit https://nightingaledvs.com/subscribe/ to subscribe
Read more…
127
1 response
Shachee Swadia
in
Nightingale
May 18, 2021
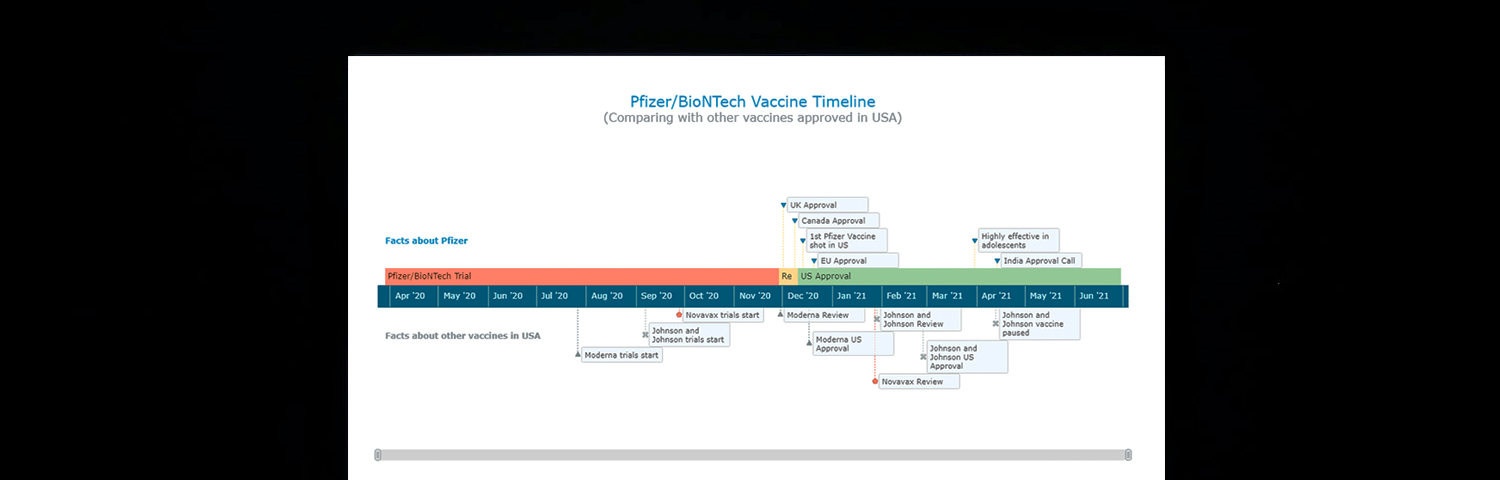
Creating Interactive Timelines with JavaScript
A step-by-step guide to visualizing the development of…
Read more…
710
2 responses
Claire Santoro
in
Nightingale
May 13, 2021
HUGE NEWS AT NIGHTINGALE!
Plus, Three Questions with Pei Ying Loh and the sexiest jobs of the 21st…
Read more…
53
1 response
Fredrick Boshe
in
Nightingale
May 6, 2021
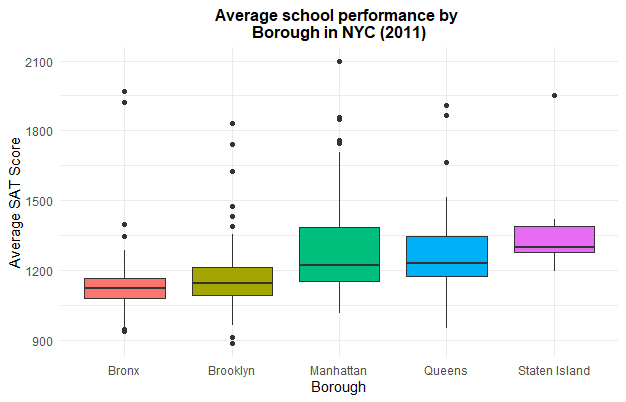
How Perceptions Can Skew Reality: A Data Visualisation Approach
How NYC schools’ academic performance…
Read more…
93
1 response
Ravi Mistry
in
Nightingale
Mar 24, 2021
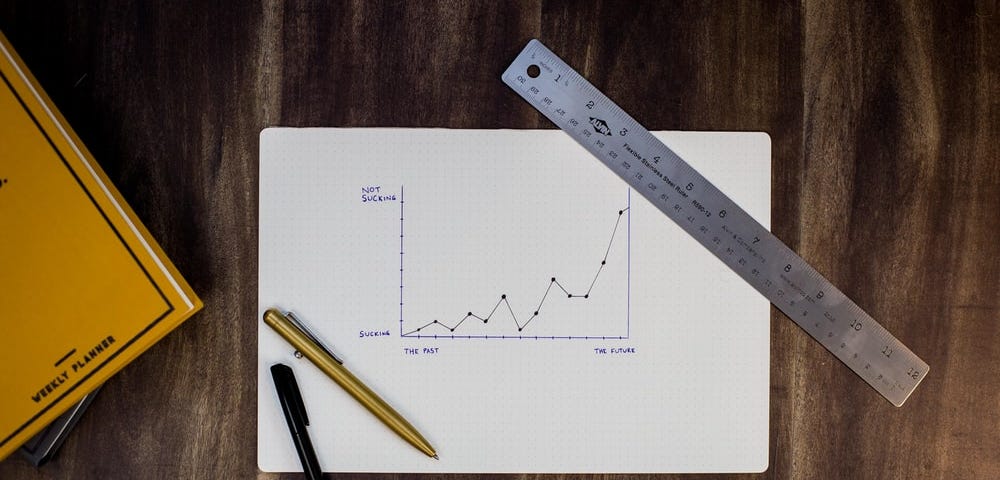
Working with #Dataviz in 2021 — What’s Next? (And What Matters?)
Read more…
220
2 responses
Josh Strupp
in
Nightingale
Mar 10, 2021
Visualizing the Gap
The NBA and WNBA wage gap explained via professional chess, Major League Soccer…
Read more…
177
5 responses
Alana Pirrone
in
Nightingale
Mar 9, 2021
Comparing Survey Responses over Two Time Periods
How to display the same data six different ways
Read more…
159
4 responses
Eli Holder
in
Nightingale
Mar 4, 2021
Radical Dots Simulator
Visualizing extreme belief formation, echo chambers, polarization, and attitude…
Read more…
463
1 response
Benoit Pimpaud
in
Nightingale
Feb 17, 2021
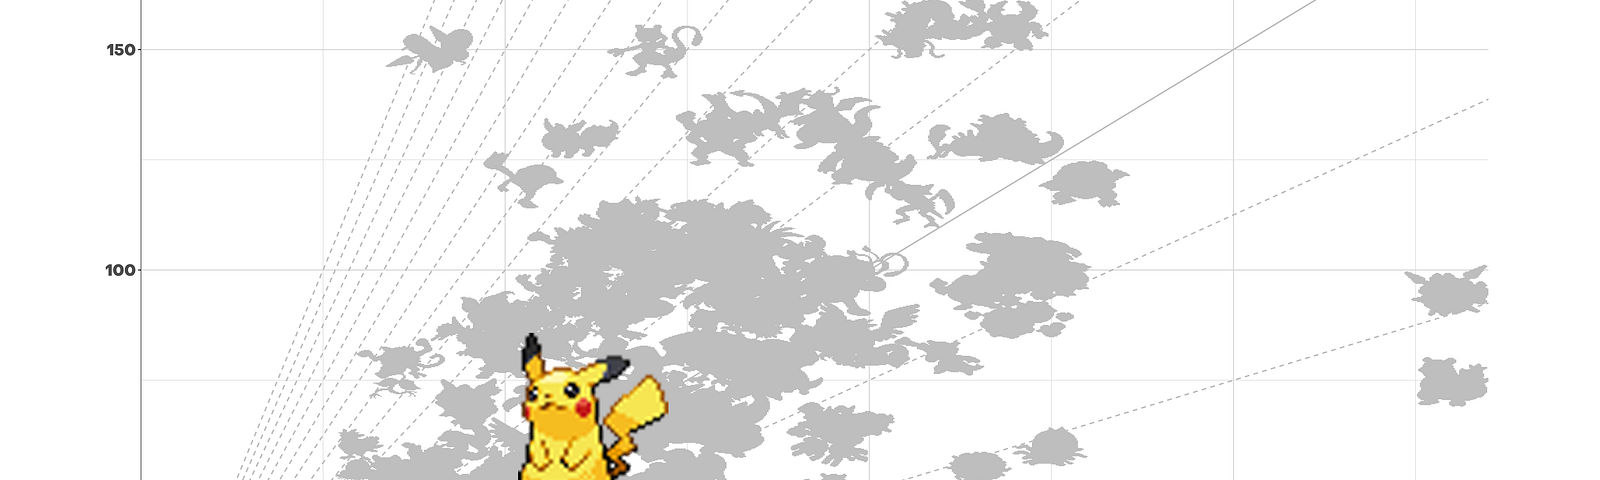
Gotta Grid’em All!
How to improve chart clarity by considering your plot background
Read more…
224
1 response