Homepage
Open in app
Sign in
Get started
All stories
How To & Career
Historic Data Viz
We moved to: https://nightingaledvs.com
Tagged in
Design
Nightingale
We moved to
https://nightingaledvs.com
!
More information
Followers
16.6K
Elsewhere
More, on Medium
Design
Jason Forrest
in
Nightingale
Jun 28, 2019
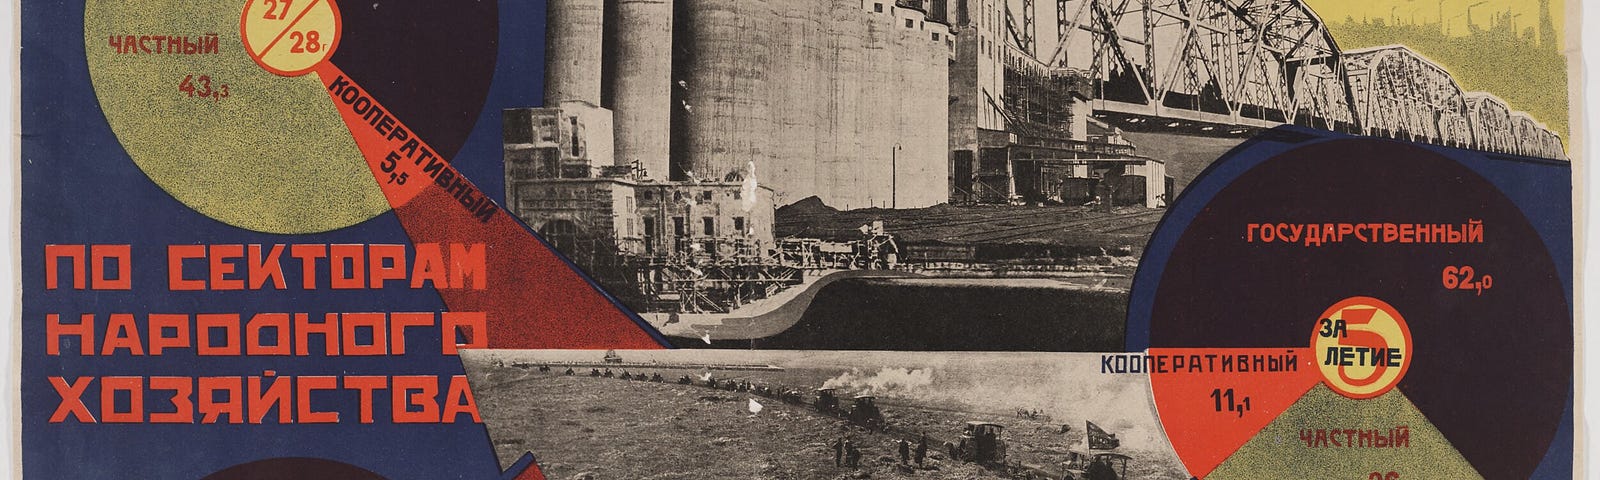
Data Visualization in the Age of Communism
The Soviet Union used data to inspire, terrify, and…
Read more…
1.5K
2 responses
Mary Aviles
in
Nightingale
Oct 5, 2021
Print subscription starts today!
Visit https://nightingaledvs.com/subscribe/ to subscribe
Read more…
127
1 response
Sheldon.studio
in
Nightingale
May 12, 2021
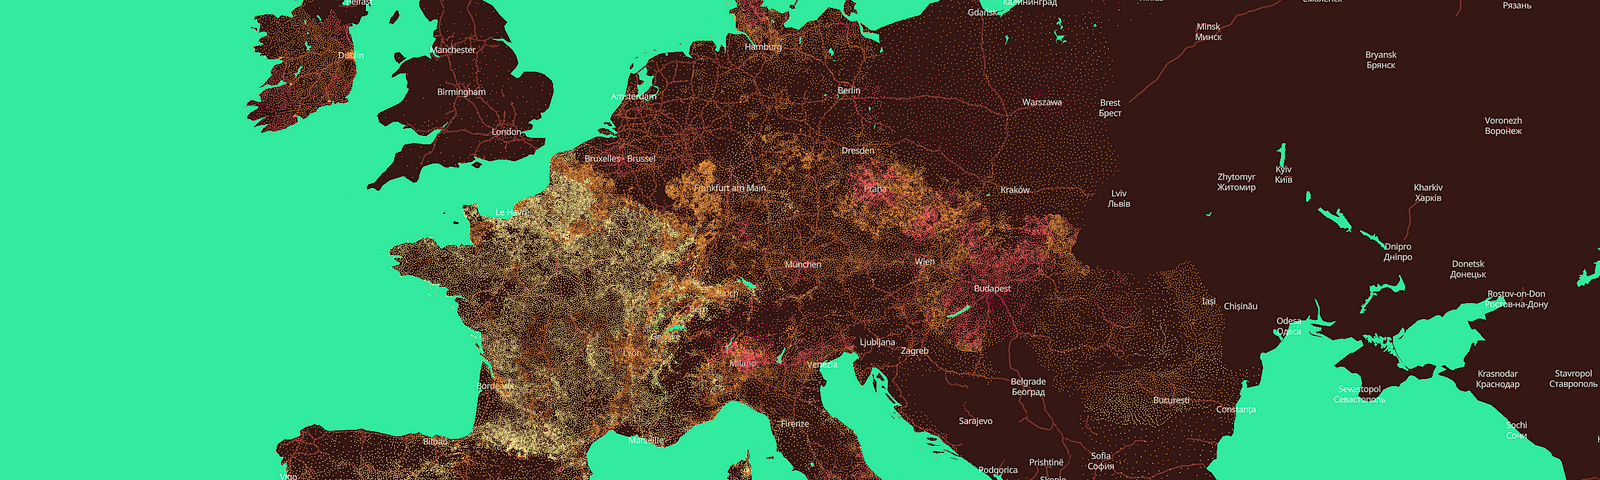
Data Enabling: the Glocal Climate Change Design Process
How I learned to stop visualising and to start…
Read more…
214
1 response
Mathieu Guglielmino
in
Nightingale
May 5, 2021
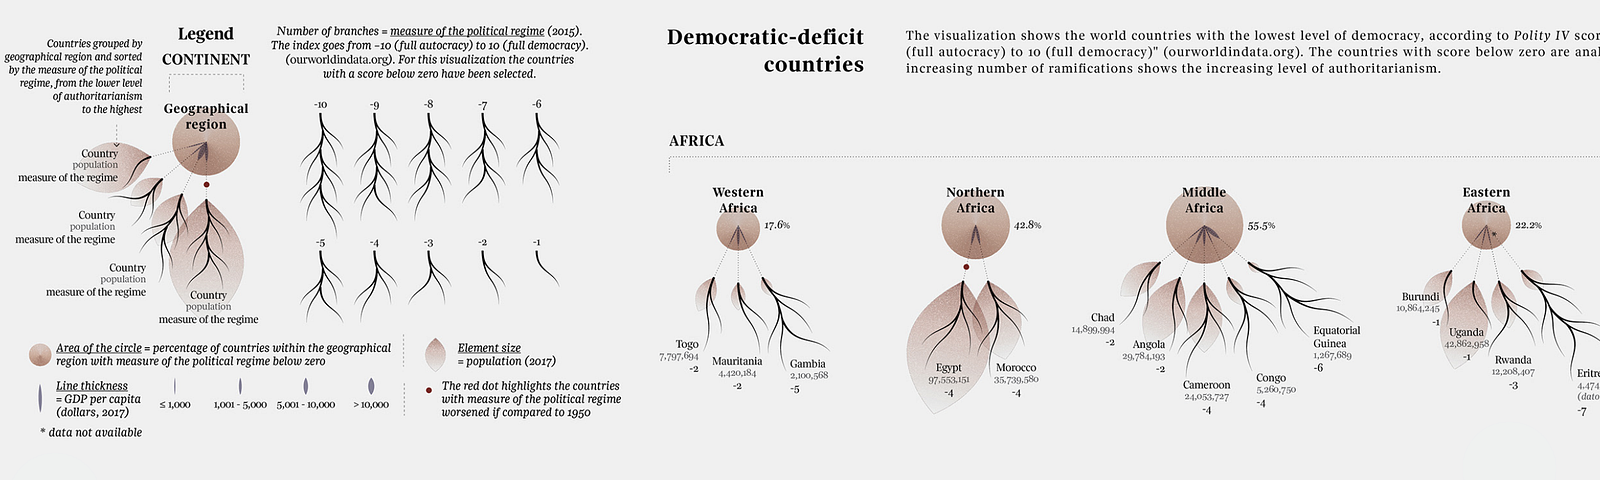
The Five Rules of Harmony in the Art of Federica Fragapane
Data visualization as an art should strive…
Read more…
189
1 response
Eli Holder
in
Nightingale
Apr 27, 2021
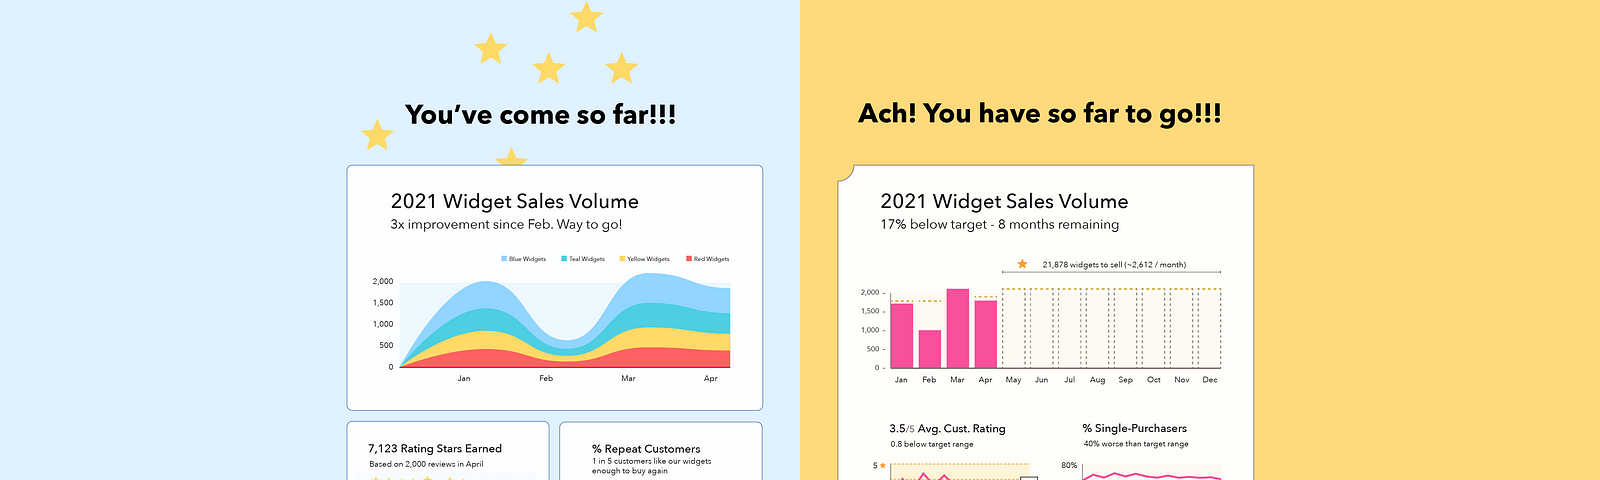
Dashboard Psychology: Effective Feedback in Data Design
How the psychology of feedback explains, “What
…
Read more…
669
6 responses
Lilach Manheim
in
Nightingale
Apr 21, 2021
The Most Important Role You’re Not Hiring for Your Data Team: The Information Architect
Read more…
477
7 responses
Alana Pirrone
in
Nightingale
Mar 9, 2021
Comparing Survey Responses over Two Time Periods
How to display the same data six different ways
Read more…
159
4 responses
Benoit Pimpaud
in
Nightingale
Feb 17, 2021
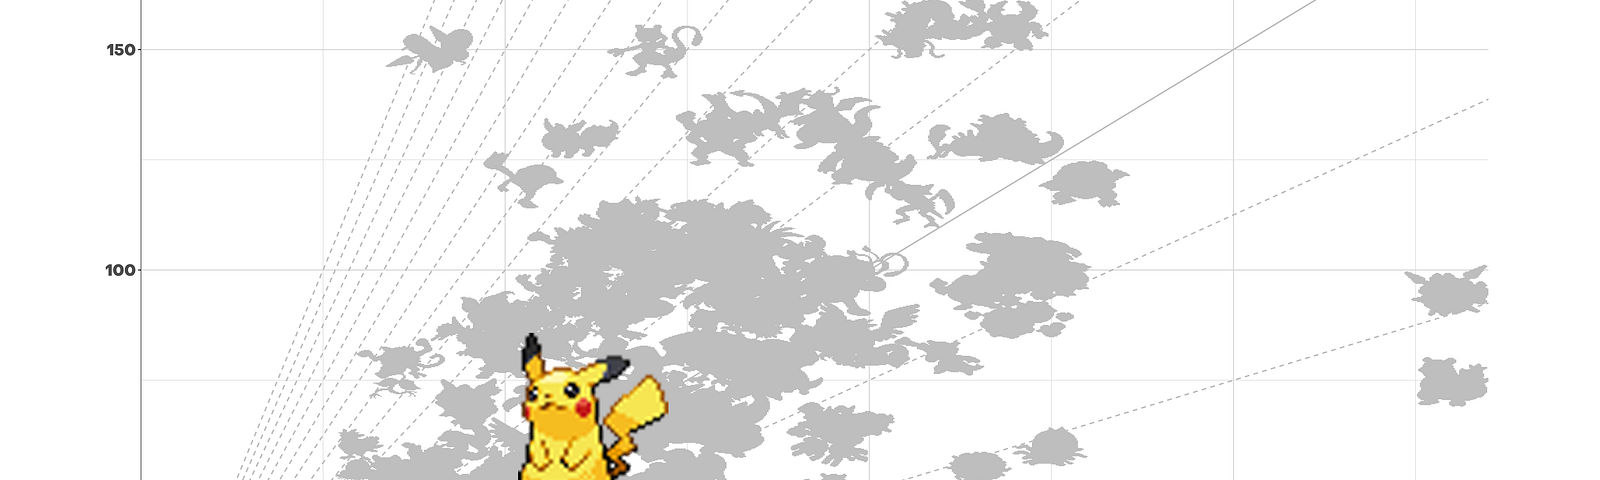
Gotta Grid’em All!
How to improve chart clarity by considering your plot background
Read more…
224
1 response
Emilia Ruzicka
in
Nightingale
Feb 15, 2021
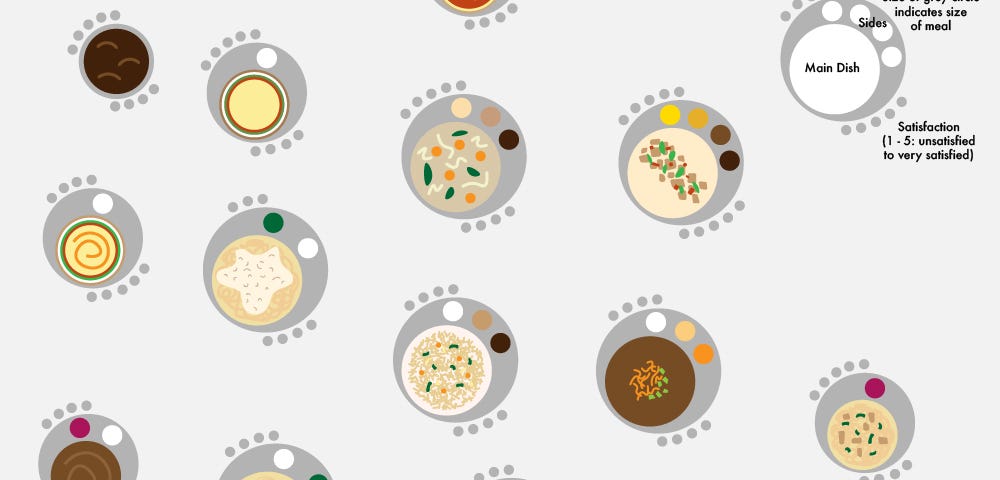
Food for Thought: Part 1 of a Yearlong Personal Data Project
Read more…
213
1 response
Ben Dexter Cooley
in
Nightingale
Jan 22, 2021
Data Visualization as Grief
What we gain when we think beyond spike maps, choropleths, and curvy case…
Read more…
154
2 responses