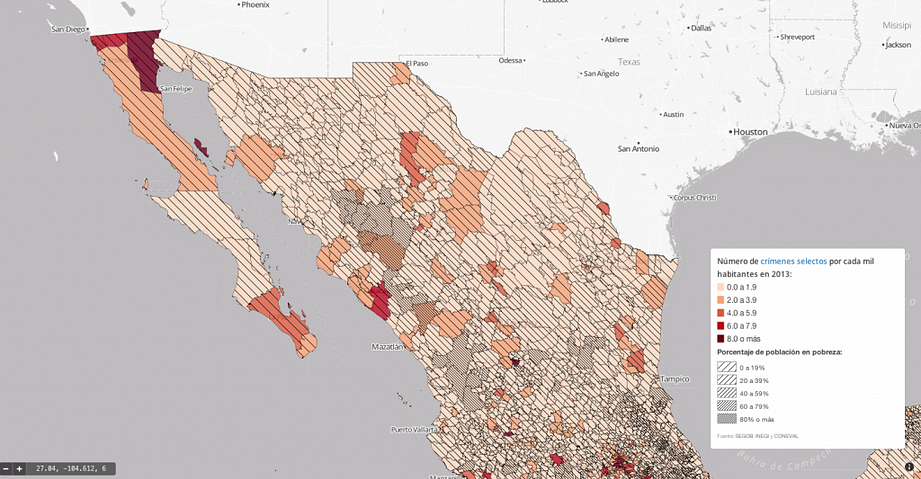
How safe is Mexico? That is a frequent question people ask me. There is even a…
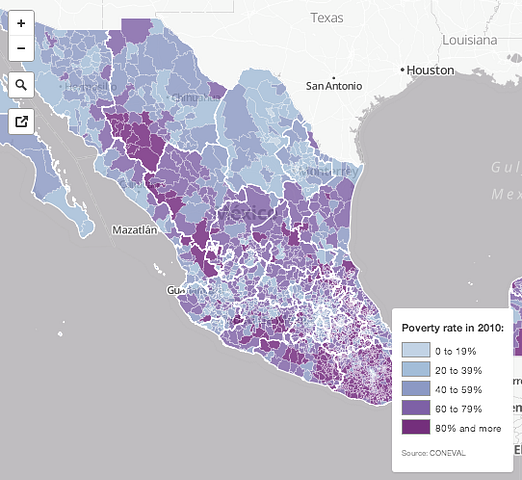
This map shows the percentage of the population living in poverty per municipality during 2010 (click here for full…
This is a short but sweet post on how to create a geojson file in R . Remember that you can render geojson files in github.
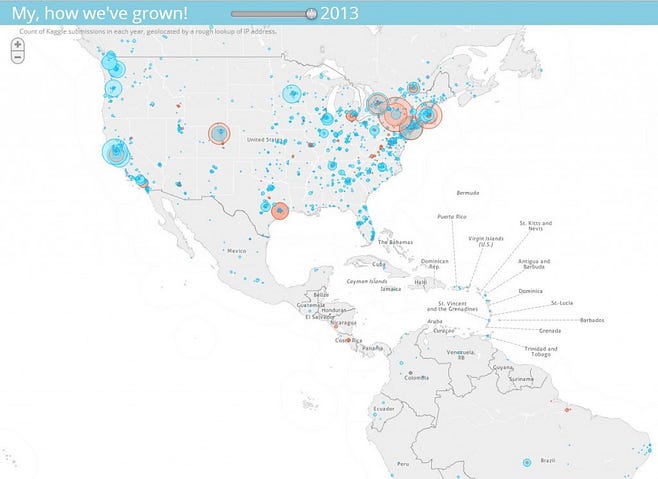
This map shows the growth of Kaggle community in North America. That is the submissions by Data Scientists to Kaggle…
I’ve struggled all morning on how to set shapefile encodings in R. Finally I got this solution to handle both French and Spanish characters.
Happy coding!
What if policy makers worked like entrepreneurs and engineers? Sometimes, public…
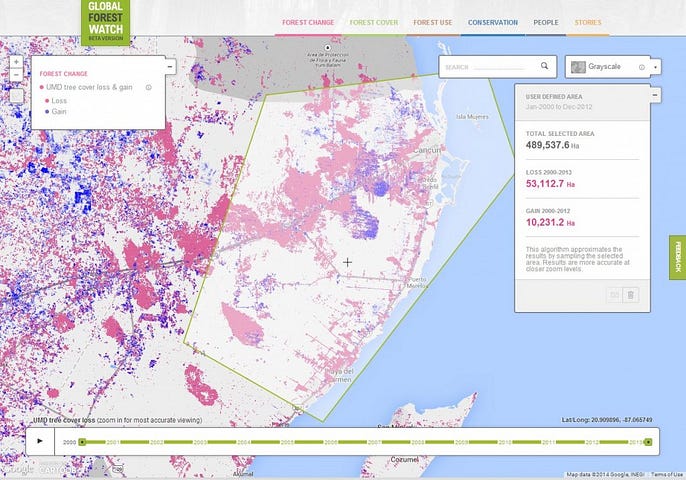
The map above shows forest change from 2000 to 2013 in the Mayan Riviera area of Mexico. The map…