Homepage
Open in app
Sign in
Get started
Top Stories published by Plotly in 2015
All
2015
Sort by most read
Plotly
in
Plotly
Aug 19, 2015
How to Analyze Data: 6 Useful Ways To Use Color In Graphs
Effectively using color means your graphs…
Read more…
33
Plotly
in
Plotly
Sep 11, 2015
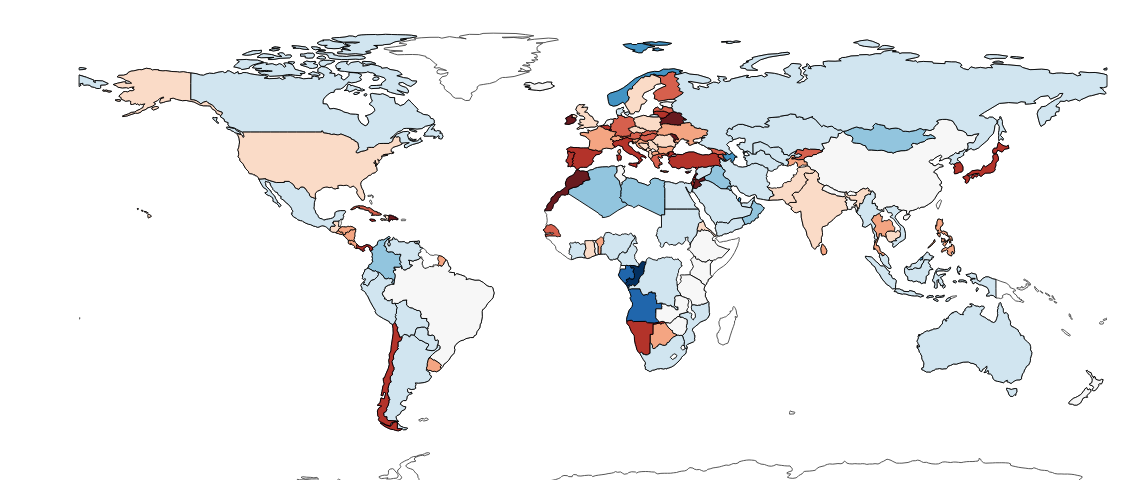
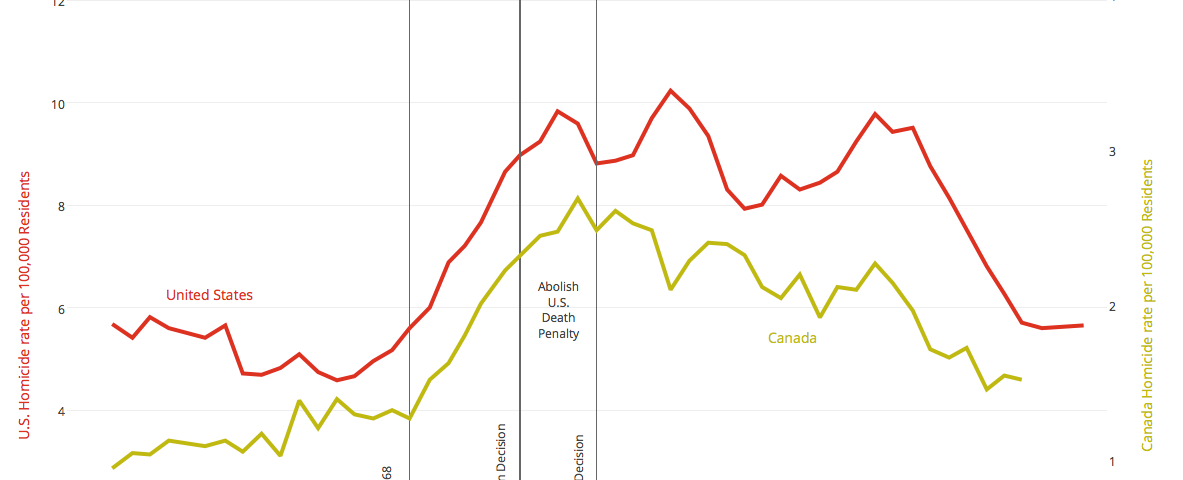
Analyzing Data: Eighteen Graphs About The Death Penalty You Should See
Read more…
10
1 response
Plotly
in
Plotly
Sep 18, 2015
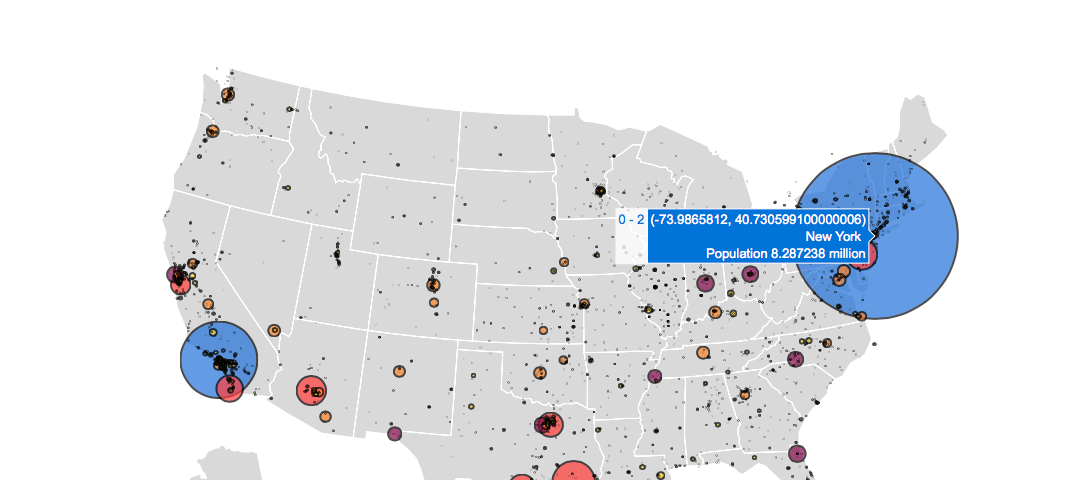
Analyze Data: Five Ways You Can Make Interactive Maps
Plotly’s new map making tools let you tell…
Read more…
15
Plotly
in
Plotly
Jul 13, 2015
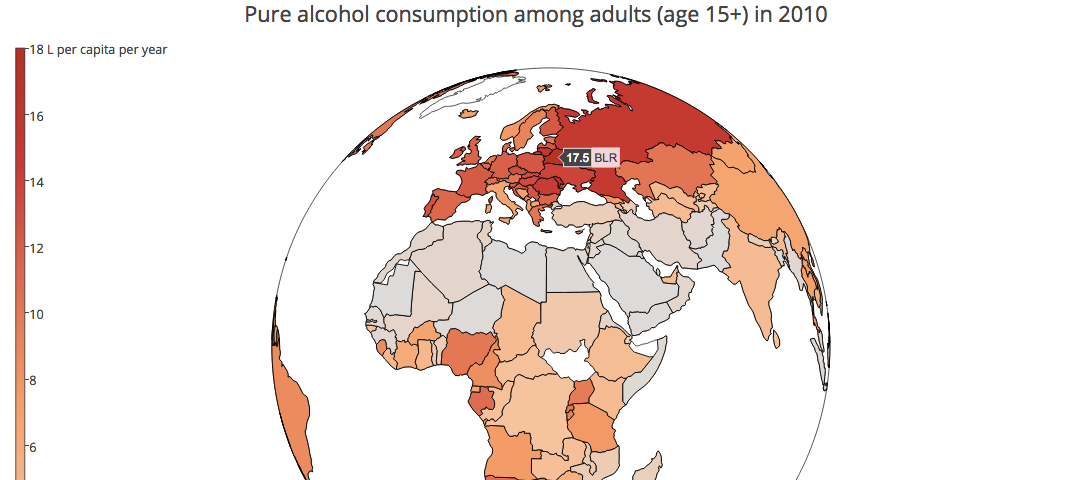
3D Graphing & Maps For Excel, R, Python, & MATLAB: Gender & Jobs, Alcohol, & Random Walks
Read more…
15
Plotly
in
Plotly
Jul 22, 2015
Eight Helpful Tips You Should Hear From Visualization Experts
Data, design, functionality, and…
Read more…
9
Plotly
in
Plotly
Dec 21, 2015
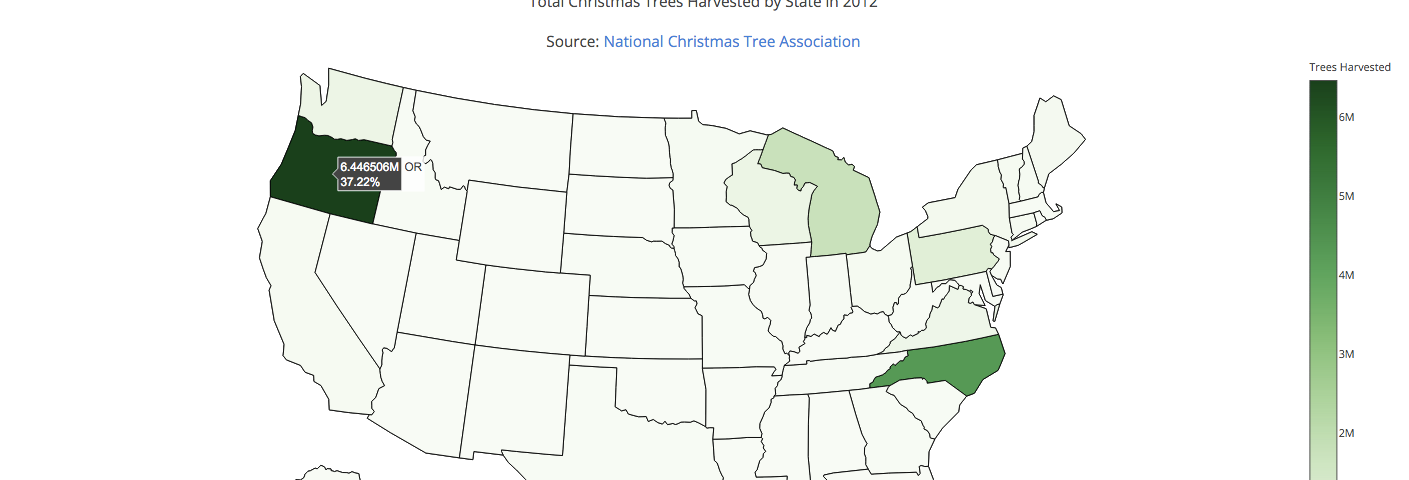
Discover Data: 6 Graphs About Christmas and New Year’s
Read more…
2
Plotly
in
Plotly
Jun 3, 2015
How To Analyze Data: 21 Graphs that Explain the Same-Sex Marriage Case, Public Opinion, & Supreme Court
Read more…
Plotly
in
Plotly
Jul 4, 2015
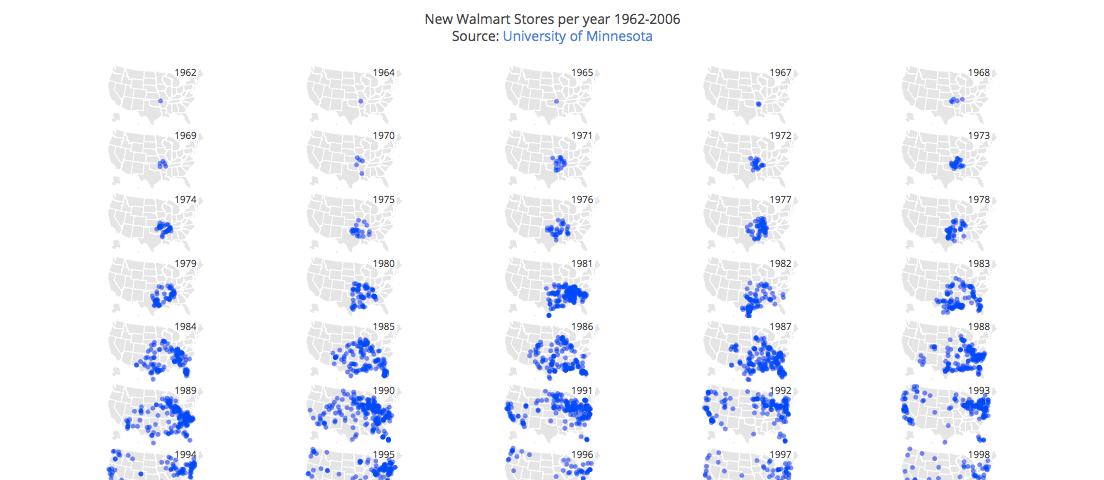
How To Analyze Data: Seven Beautiful Ways You Can Explain Money, Fashion, Politics, & Technology
Read more…
6
2016
About
Plotly
Plotly is a data visualization company that makes it easy to build, test, and deploy beautiful interactive web apps, charts and graphs—in any programming language.
More information
Tags
SaaS
Data Visualization
Data Science
Data Visualization
Same Sex Marriage
Supreme Court
Data Visualization
New Year
Christmas
Big Data
Editors
Plotly
Adam Schroeder
Chris Parmer
Writers
JP Hwang
Avery Smith
Emilie Burton
Hannah Ker
Cody Austin Davis
Dave Gibbon
Sachin Seth
Tanya Lomskaya
Alex Kalish