1.子圖的格式可以是一個子圖或是多個子圖共同存在一個圖中,因此可以多個子圖一起存在於單個圖中。
1.箱形圖又稱為盒須圖、盒式圖或箱線圖,是用來顯示數據分散情況的統計圖,因形狀如箱子而得名,適用於較大數據集差異的表現。
2.它能顯示出一組或多組資料的最大值、最小值、中位數、及上下四分位數。
3.箱形圖的方框會從數據的下四分位值延伸到上四分位值,因此可以看到四分位間距。方框內的水平線表示中位數,從框延伸的晶須(whisker)顯示數據范圍,可以顯示數據異常值(outliers),異常值通常…
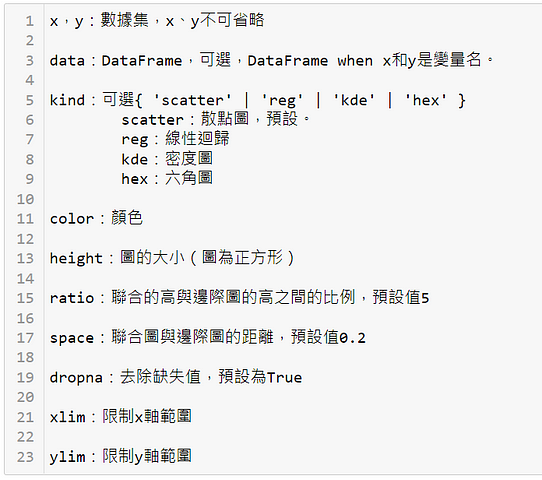
聯合圖主要是利用單變量(例如直方圖)和雙變量(例如散點圖)同時展示數據的分布。。
2.每個子圖都各自的x軸及y軸,figure可以通過plt.figure()來實現,它可以包含一個或多個子圖,默認包含一個子圖。
首先導入matplotlib.pyplot,並執行%configInline Backend . figure_format = ‘retina’以提高jupyter…
鐵達尼號資料下戴網址 https://github.com/mwaskom/seaborn-data
下載titanic.csv檔案,鐵達尼號各項數據說明:survived:是否存活(1表示存活,0表示死亡)pclass:艙等的等級(1–3表示艙位從高到低)sex:性別age:年齡( 年齡小於 1…
接下來說明pandas操作六到十二。
先導入pandas及numpy並創造物件df。