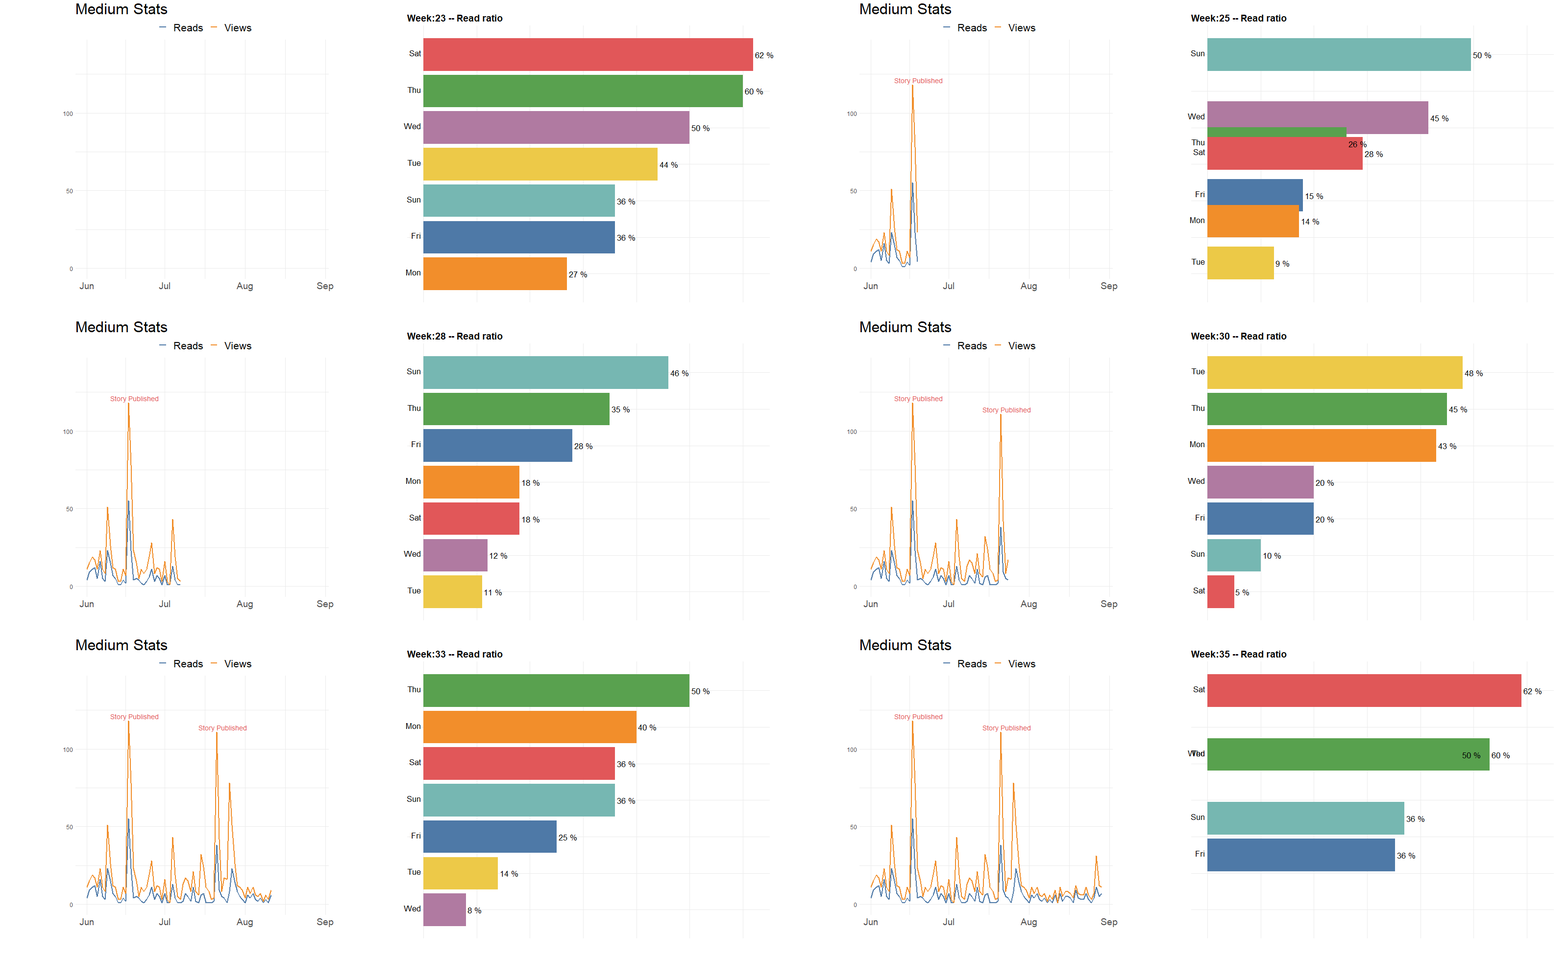
Simple Way to Create Animated Charts in R
A simple way to create animated charts in R is to use the gganimate extension, available as part of ggplot2. It permits you to display your data dynamically. If you are familiar with ggplot2, all that is necessary is to add a transition function at the end and set the parameters
More informationFollowers
