From Suffer Score to Relative Effort
Written by: Chris Spada and Will Meyer
One of our most popular Premium features is Suffer Score, a way to quantify effort during an activity using heart rate data…
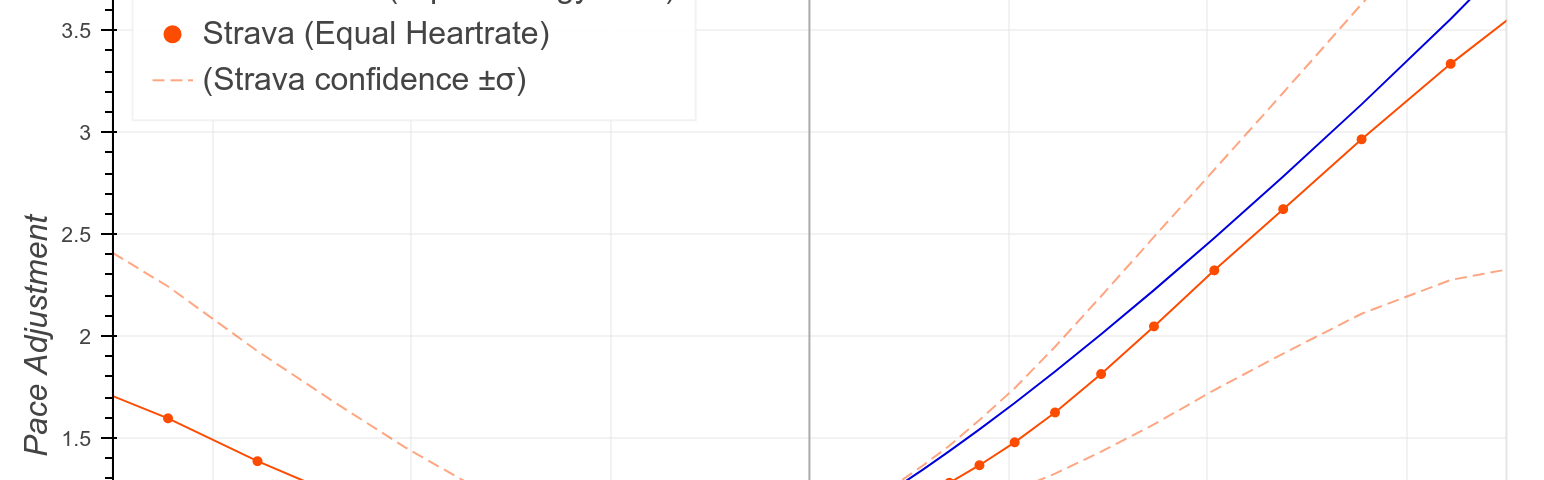
For our summer Strava Jam I used our new bulk access activity stream dataset to improve our current GAP (Grade Adjusted…
Streams are what we call the raw measurement sequences that define a Strava activity, such as latitude/longitude, time, heartrate, power, elevation, or speed. Strava has more than 150 TB of stream data from over 1 billion activities. This dataset offers enormous potential…
Just as our athletes are obsessed with tracking and analyzing their athletic pursuits, we here at Strava are obsessed with tracking our own performance; but instead of wattage and pace, we’re concerned with activity and engagement. In this post, I’ll talk a little bit about the infrastructure…
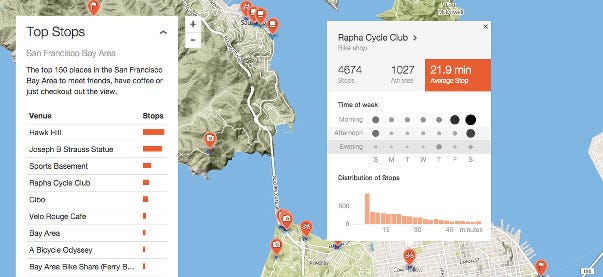
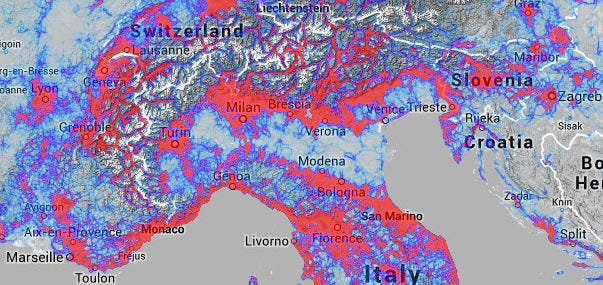
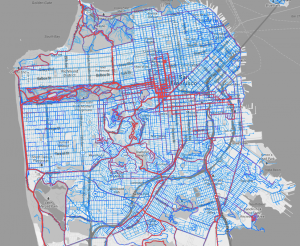
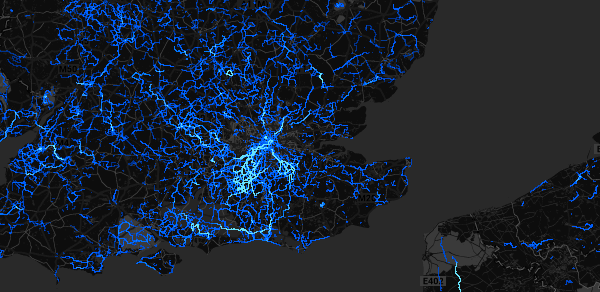
Strava has done a lot of work figuring out how athletes move; we have global heatmaps, challenge heatmaps, personal…
Recently we introduced a heatmapping feature on Strava, our first feature built using the Go programming language. This is…
On Saturday July 20th Strava athletes covered 4,890,000 miles in over 326,000 combined hours. To get a look…