Homepage
Open in app
Sign in
Get started
All Stories published by Tech@Carnot on August 12, 2020
All
2020
August
01
02
03
04
05
06
07
08
09
10
11
12
13
14
15
16
17
18
19
20
21
22
23
24
25
26
27
28
29
30
31
Sort by most read
Yash Sanghvi
in
Tech@Carnot
Aug 12, 2020
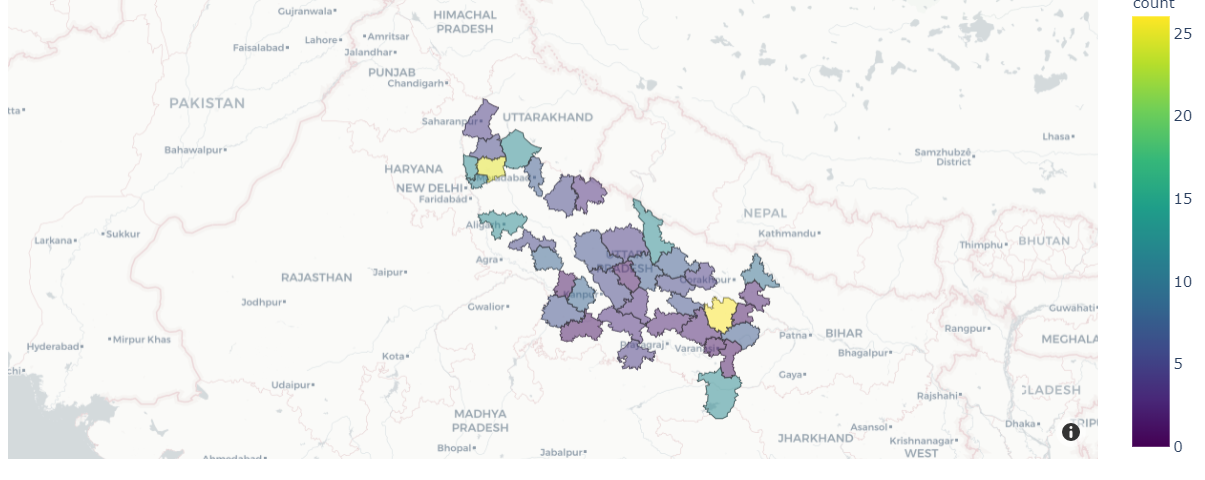
[Plotly + Mapbox] Interactive Choropleth Visualization Tutorial
A choropleth without a base map often…
Read more…
29
Yash Sanghvi
in
Tech@Carnot
Aug 12, 2020
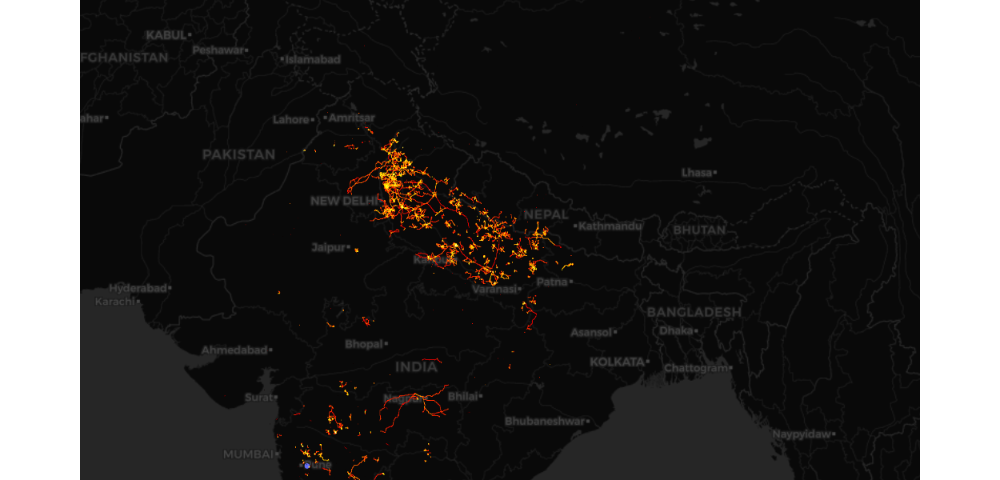
[Plotly + Datashader] Visualizing Large Geospatial Datasets
Have geospatial datasets several GBs…
Read more…
150
3 responses
Yash Sanghvi
in
Tech@Carnot
Aug 12, 2020
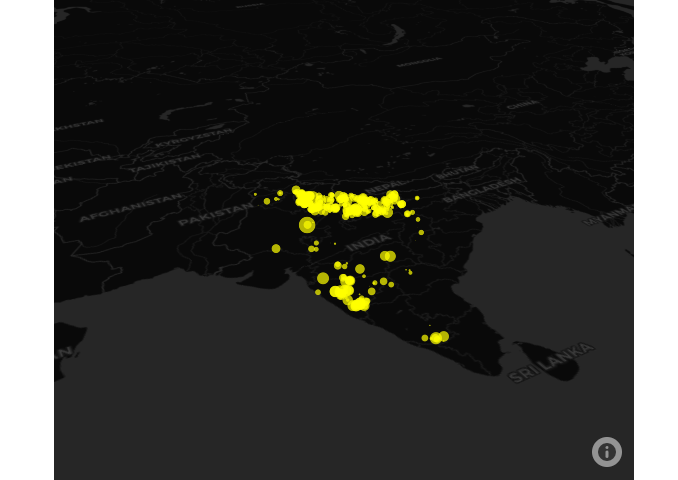
[Plotly + Mapbox] Interactive Scatter Plot Tutorial
Want to create a scatter map-visualization with…
Read more…
23
August 11, 2020
August 13, 2020
About
Tech@Carnot
Carnot is AI enabled Agri IOT platform that helps farmers make up to 30% more money
More information
Tags
Geospatial
Chart Studio
Plotly Express
Mapbox
Plotly
Geospatial
Python
Big Data
Datashader
Plotly
Editors
Carnot Tech Team
Pushkar Limaye
Writers
Prathamesh Joshi
Juhi Kulkarni
Pushkar Limaye
Hiten Rajgor
Vihang Salgat