Beyond the Countdown: Why btbjb is the Definitive Data Hub for the 2028 Bitcoin Halving

The Bitcoin Halving is more than just a countdown; it is the world’s first transparent, immutable, and programmatic monetary experiment. As we approach the 2028 Bitcoin Halving, the market noise is becoming deafening.
Most tracking sites offer nothing more than a simple clock and static text. However, for serious researchers looking to understand the “logic of scarcity,” a basic timer isn’t enough. Enter btbjb.com — a data visualization powerhouse that transforms raw on-chain metrics into actionable, interactive insights. Here is a deep dive into why this platform is outperforming the competition.
1. Dynamic Precision: A Logic-Driven Countdown
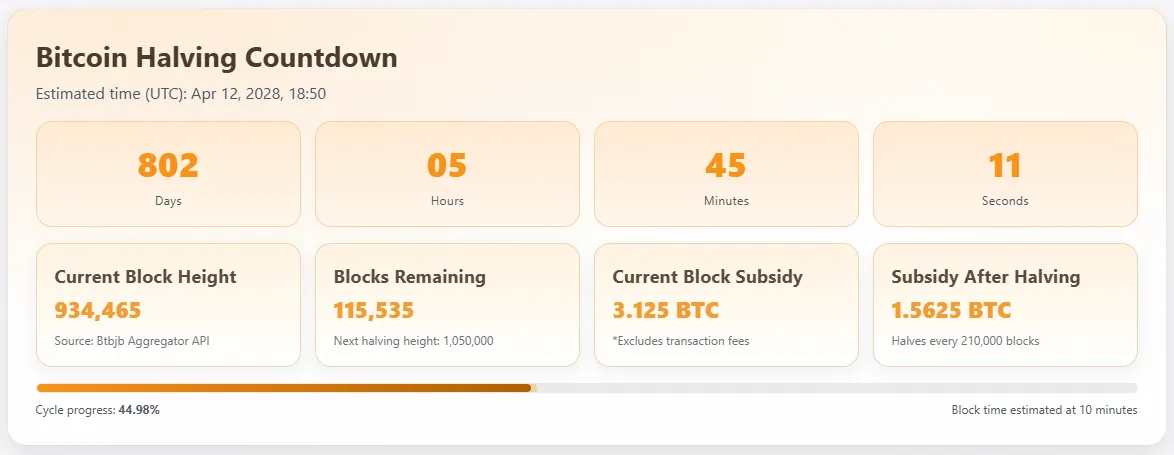
While most sites tell you when the halving might happen, btbjb explains how it happens. Since the halving is triggered by the 21,000th block rather than a calendar date, btbjb tracks real-time network hashrate, average block times, and difficulty adjustment cycles. This provides a high-fidelity dynamic countdown that reflects the micro-fluctuations in network production speed.
2. Interactive Historical Overlays: Decoding Market Cycles

The core edge of btbjb lies in its Interactive Price & Halving Node Charts. Unlike static images found elsewhere, these charts feature:
- Cycle Comparison: Overlay the price action of 2012, 2016, 2020, and 2024 to identify patterns and deviations.
- Precision Data Points: Hover over any historical node to extract specific metrics without toggling between multiple tabs.
- Macro Context: Trace the path from the Genesis block to the future 2028 target with seamless zoom capabilities.
3. Quantifying the “Supply Shock”: Post-Halving Performance Distribution
“What happens after the halving?” Instead of speculation, btbjb uses the Post-Halving N-Day Return Distribution Tool. By plotting returns at intervals of 30, 60, 90, 180, and 365 days across all previous cycles, the platform debunks the “instant moon” myth. It visualizes the actual time window required for a supply shock to manifest as market performance.
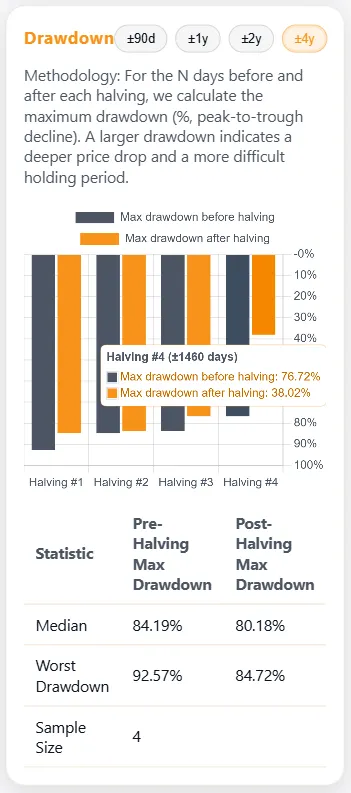
4. Risk Management: Historical Drawdown Analysis
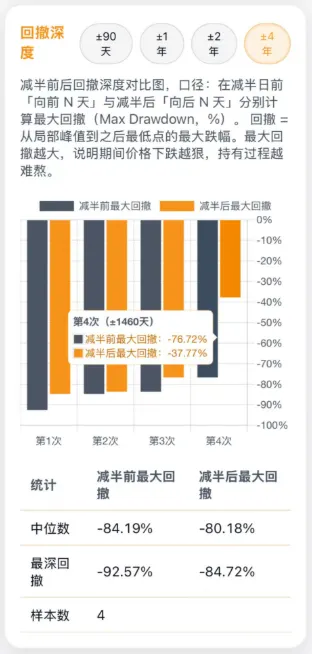
Growth is easy to watch; volatility is hard to stomach. The Pre/Post-Halving Drawdown Comparison tool is a godsend for risk managers. It visualizes the extreme price corrections (drawdowns) that occurred in every cycle. By comparing the “shakeouts” of 2016 and 2020, users can build grounded expectations for the “growing pains” Bitcoin faces on its way to new highs.
5. Behavioral Insights: The Seasonality of BTC
Does Bitcoin have a seasonal pulse? The “Best Days for Gains” Interactive Heatmap analyzes over a decade of daily performance. By identifying historical clusters of strength and weakness, this tool offers a unique statistical lens into global liquidity cycles and investor behavior.
6. Practical Calculus: The “Time-to-Green” Metric
One of btbjb’s most user-centric features is the “Time Required to Reclaim Profit” calculator. If you entered the market at a historical peak, how long did it take — on average — to break even? This tool helps foster a long-term “low time preference” mindset by calculating the historical recovery periods for various entry points.
7. The Macro Perspective: Inflation, Gold, and the USD
Bitcoin was engineered to be “Harder Money” than gold and more reliable than the Dollar. btbjb proves this through three interactive dimensions:
- Annual Issuance Dashboard: Watch the production rate slow down in real-time as we approach the 21-million cap.
- Inflation Rate Calculator: When the 2028 halving slashes block rewards from 3.125 to 1.5625 BTC, Bitcoin’s inflation rate will halve again. This tool lets you compare BTC’s scarcity directly against major fiat currencies.
- Purchasing Power Race: An interactive comparison of BTC vs. Gold vs. USD, visualizing the erosion of fiat value over time.
Conclusion: Data is the Only Truth
Get Bitcoin’s stories in your inbox
Join Medium for free to get updates from this writer.
In an era of AI-generated noise and social media hype, raw data remains the ultimate signal. btbjb doesn’t tell you what to do — it provides the high-dimensional tools for you to see the underlying logic of the blockchain yourself.
Visit btbjb.com today to start your data-driven exploration.
No registration, no subscriptions — just pure data for the sovereign researcher.