Pick a simple standalone chart, add a piece of data, a filter, an anecdot, or some context to make it into a cohesive story.
Use a tool you are already familiar with, anything from hand drawn to illustrator to code!
Answer these questions in 1 sentence each.
*This wonderful email policy comes from the syllabi of Leah Meisterlin and Dare Brawley. I have adapted it here to reflect the content of this course.
Email is absolutely a resource for students, but it is not chat. Do not expect immediate responses from the instructor. It is…
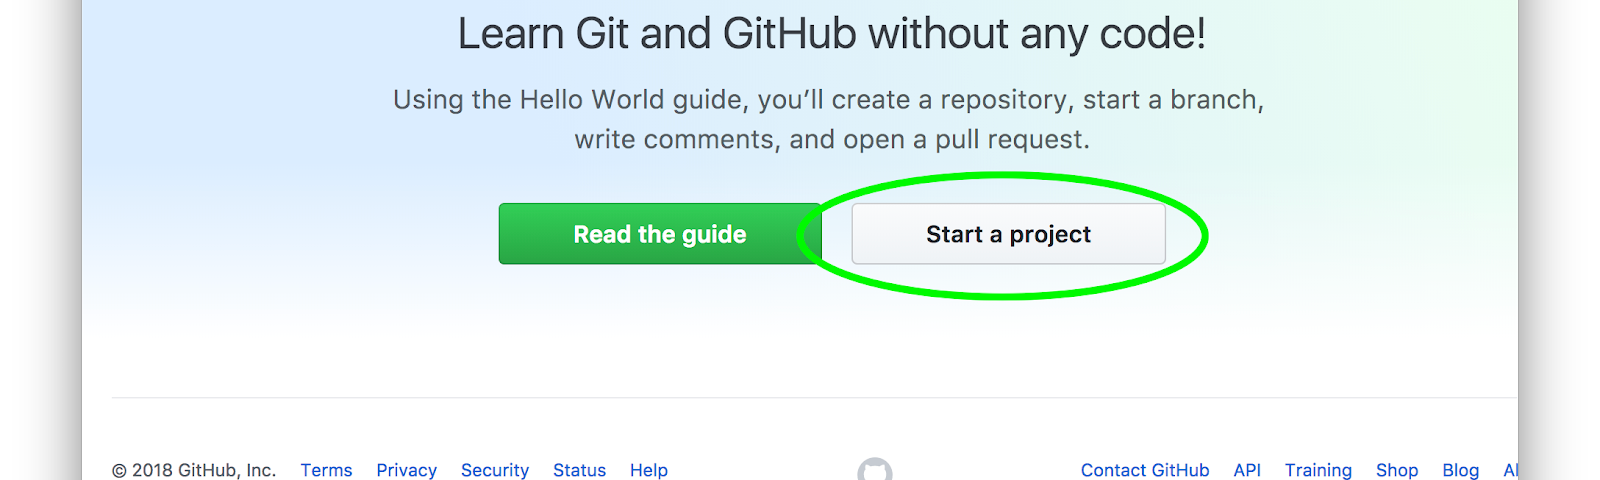
This tutorial is intended for those who have never used Github. If you already use the terminal or the…
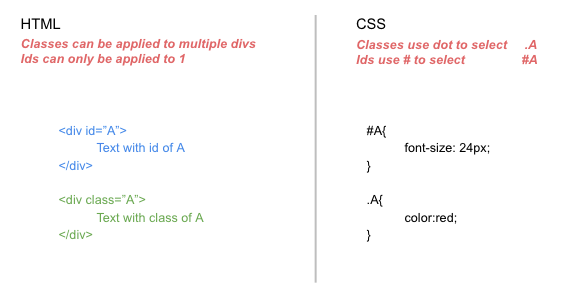
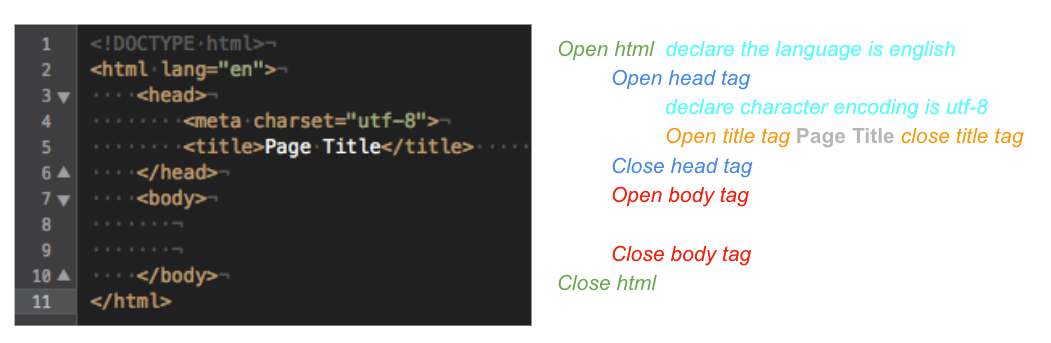
A growing list of quick code references for class
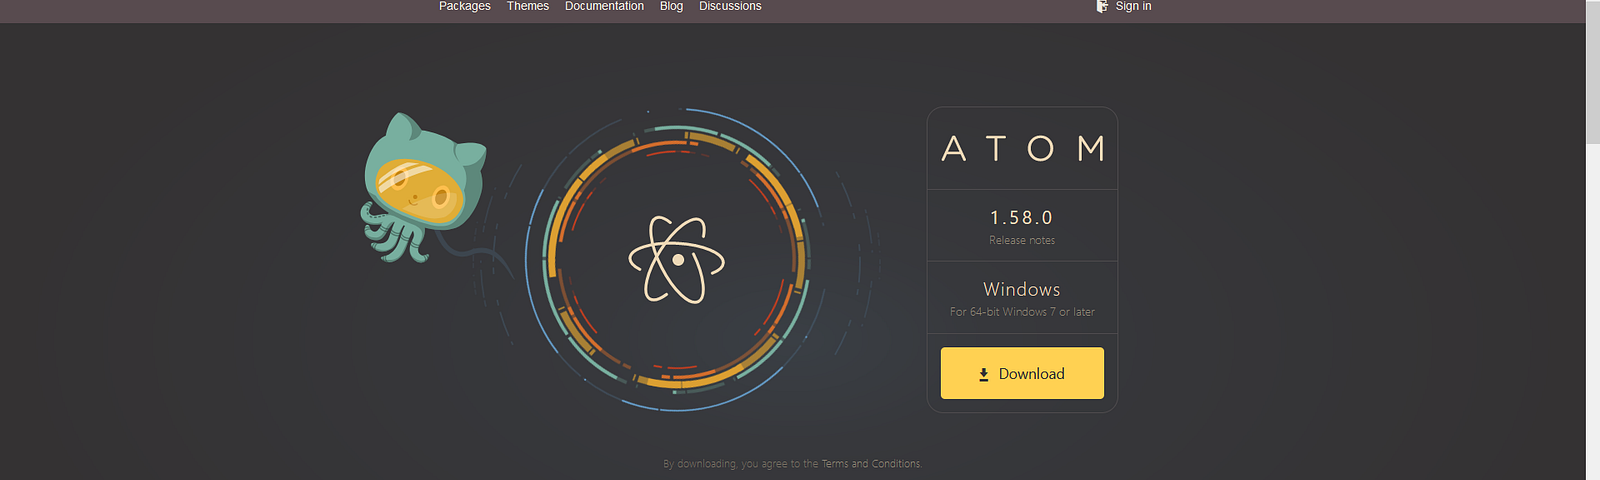
Here are local server instructions for the PC
Week 2
INTERACTIVITY!!!!!
This week we finally make truly interactive visualizations with D3!
Read and follow the class folder for chapter 10.
In this week’s _EXERCISE file, you first have to correct the wrong code I have…
Updates, transitions, and motion