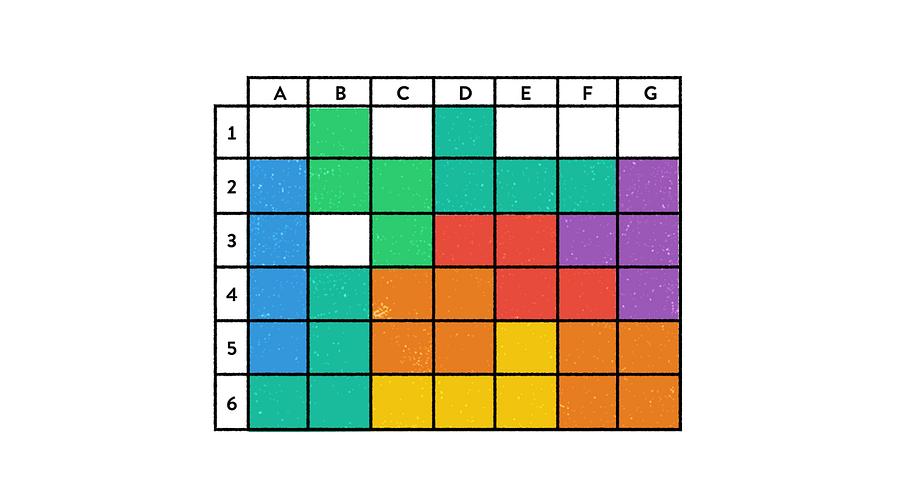
Poor tables. Where did they go wrong?
3 billion people used the internet for the first time in the past decade. Can you imagine what that was like? When I began using the internet, the web was pretty much just text. Interface design required finagling websites from knots of spreadsheet-like tables, and…
This is a direct translation of a talk I gave at the NYC D3.js meetup in January of 2016. If you’d like to see a video of the talk, you can check it out on YouTube.
Have you seen this comprehensive list of Donald Trump’s insults? Or maybe this detailed rundown…
The rise of the robot assistant is happening. Last year, Amazon’s Echo accounted for a quarter of all…
Data visualization is more popular than ever. With modern tools, anyone can create complex charts; it’s also easier than ever to choose the wrong way to visualize data . While the consequences of using a pie chart instead of a spider chart…
Being a small but profitable company, Planetary has the luxury of experimenting with some of the basics of what we…
Data visualization is everywhere. From analytics platforms to infographics, across newsrooms and social media channels, there are vast swaths of the internet devoted to delivering data…
Data-driven interfaces are on the rise. Financial District CEOs want to see a birds-eye view of their bottom line as much as Silicon Valley Co-founders want to watch their growth hackers hack. Each user has their own hopes…
These were the top 10 stories published by Mission Log; you can also dive into yearly archives: 2015, 2016, 2017, 2018, and 2022.