Homepage
Open in app
Sign in
Get started
The Stata Gallery
About
Tagged in
Tata
The Stata Gallery
This community-driven blog aims to provides readers the option to contribute and learn from each other. Feel free to submit your own Stata guides!
More information
Followers
296
More, on Medium
Tata
Shritha Sampath
in
The Stata Gallery
Jul 11
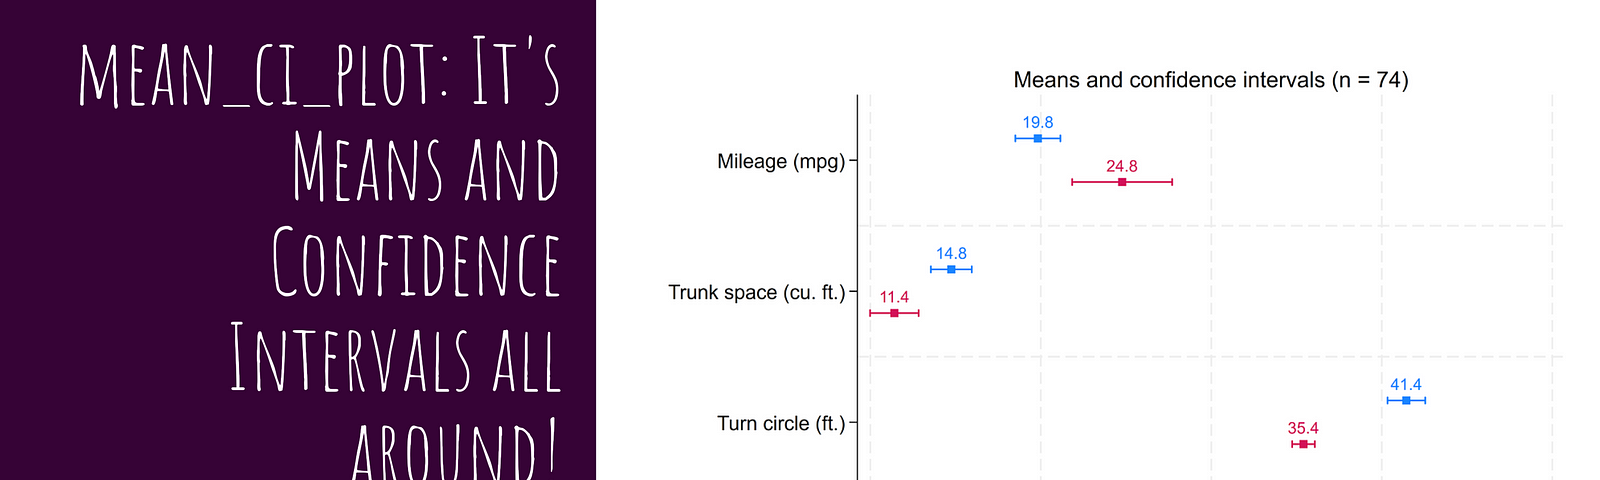
mean_ci_plot: It’s Means and Confidence Intervals all around!
Mean and Confidence Intervals: A Peek…
Read more…
2
Ketki Samel
in
The Stata Gallery
Jul 11
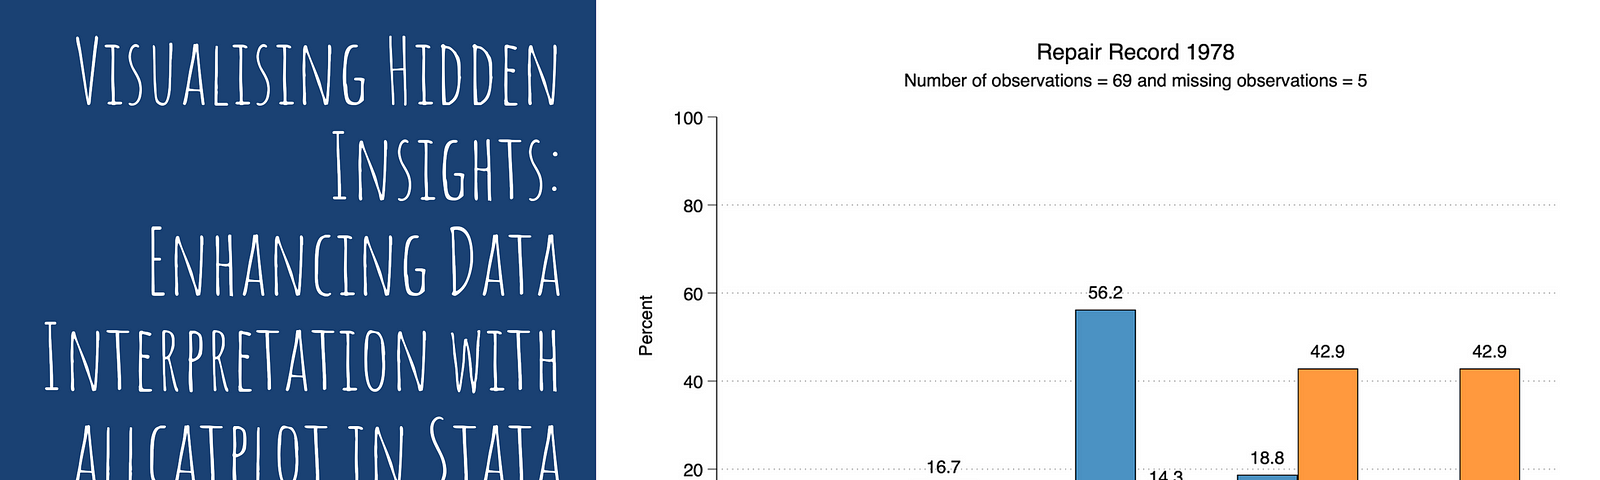
Visualising Hidden Insights: Enhancing Data Interpretation with allcatplot in Stata
Read more…
3
Shritha Sampath
in
The Stata Gallery
Jul 10
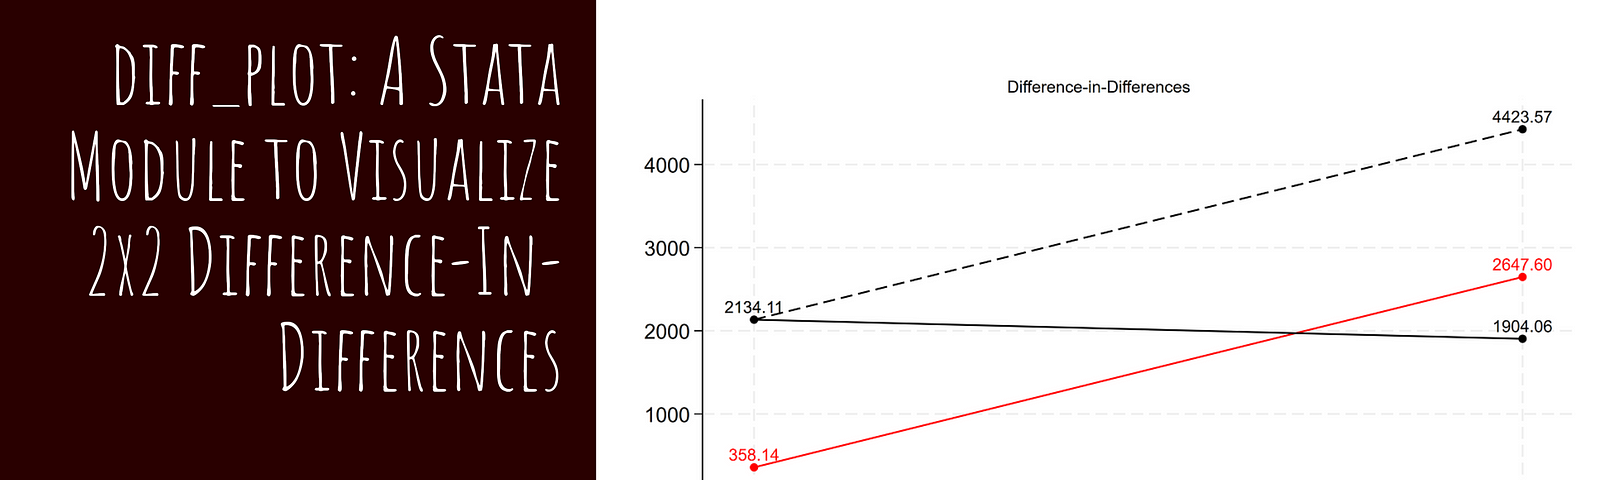
diff_plot: A Stata Module to Visualize Two-Period, Two-Group Difference-In-Differences
Read more…
4
John V. Kane
in
The Stata Gallery
May 4
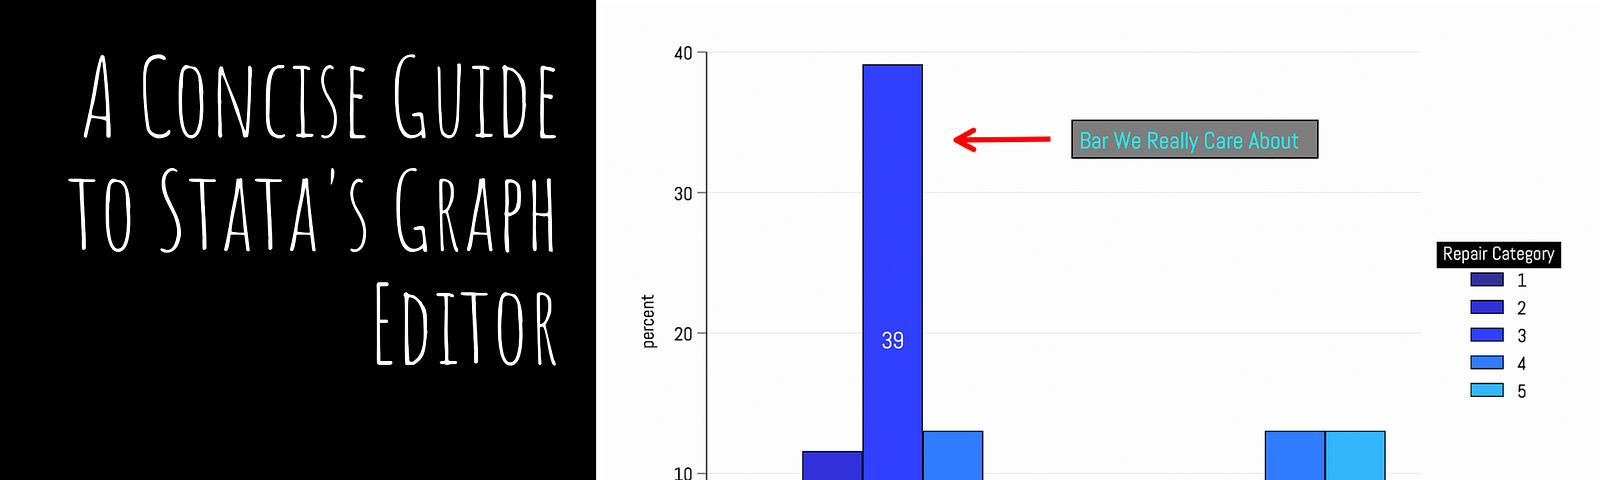
Getting More Out of Stata’s “Graph Editor”: A Concise Guide
Whether a new or long-time Stata user…
Read more…
30
1 response
Asjad Naqvi
in
The Stata Gallery
Apr 22
The BPLIM workflow for anonymizing confidential data for research
Read more…
55
2 responses
John V. Kane
in
The Stata Gallery
Apr 17
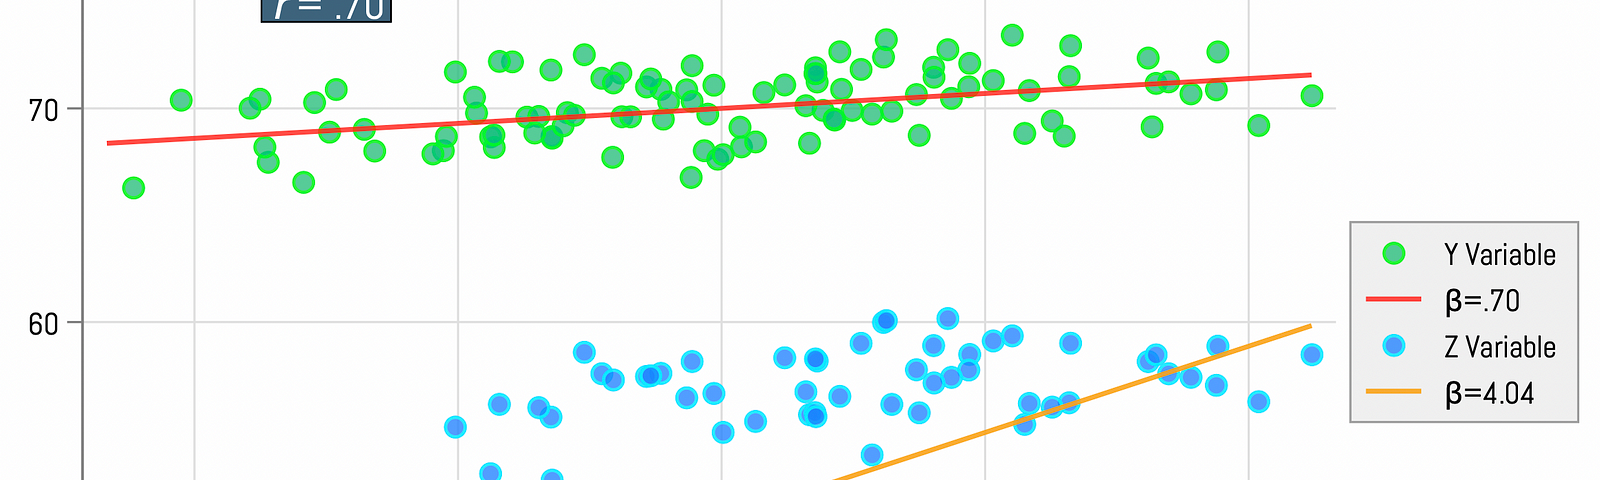
Correlation vs. Regression: A Key Difference That Many Analysts Miss
Correlation and regression…
Read more…
831
10 responses
Jamel Saadaoui
in
The Stata Gallery
Apr 15
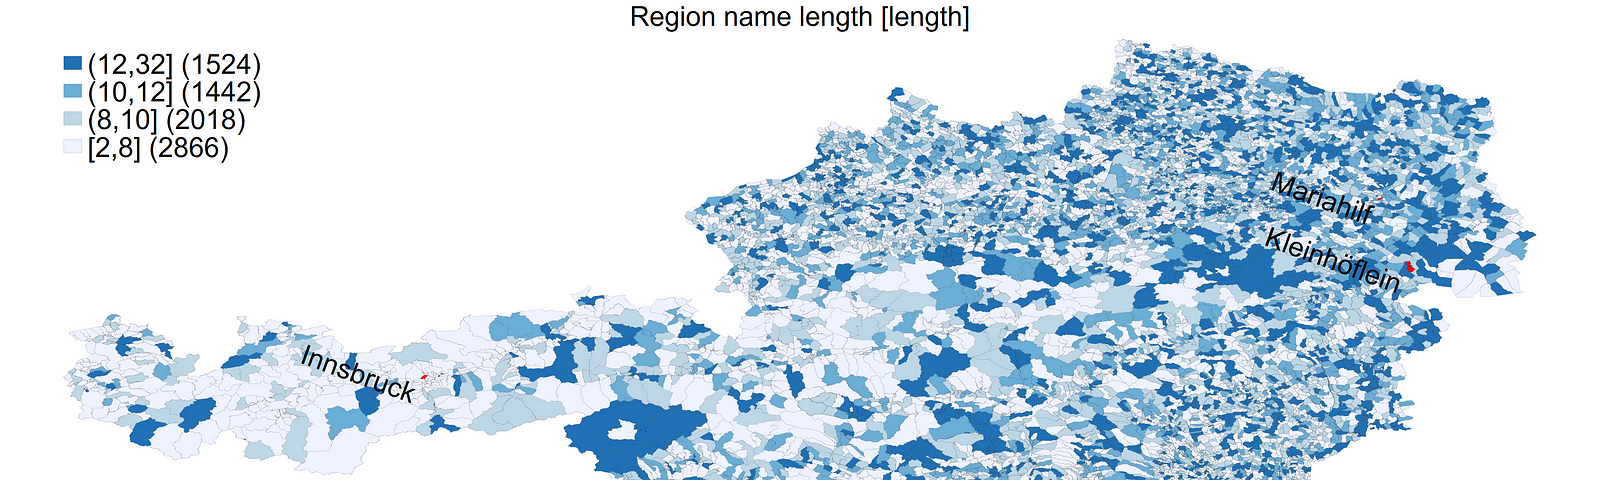
Drawing Maps for Austria with GADM data
This morning I woke up, and I saw a new story on drawing maps…
Read more…
52
Fahad Mirza
in
The Stata Gallery
Apr 3
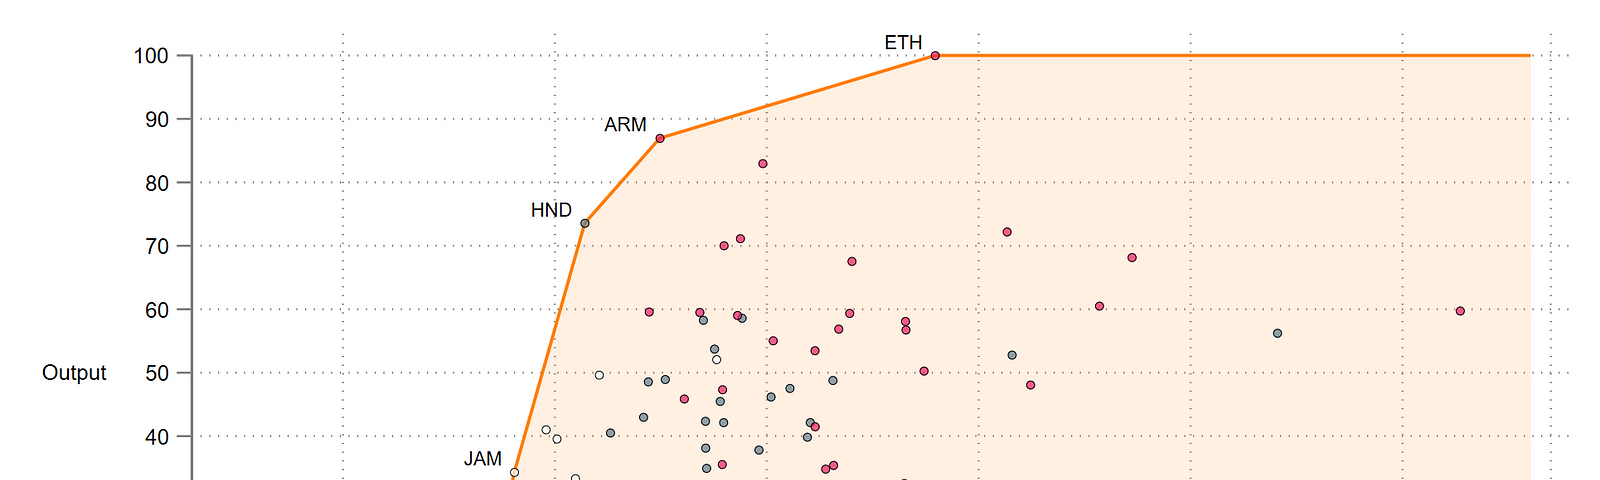
Data Envelopment Analysis (DEA)Visualization using Stata
Read more…
53
1 response
Jamel Saadaoui
in
The Stata Gallery
Mar 17
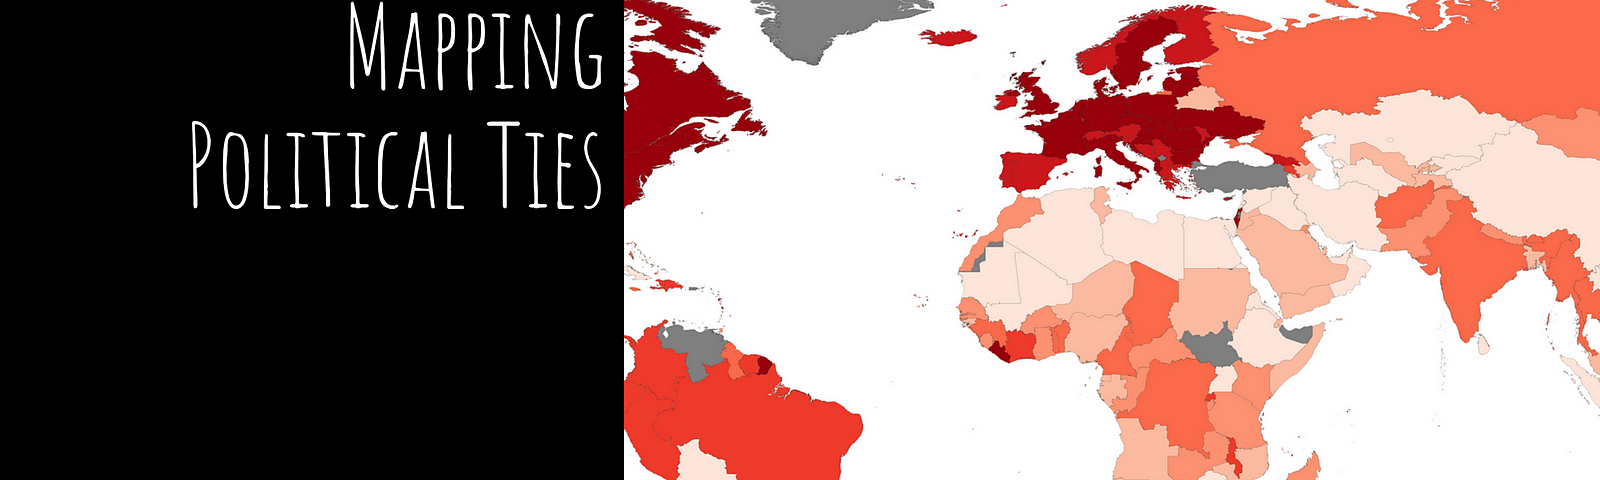
Drawing Maps for Political Ties with Stata
Today, I will build on my previous blogs to show you how to draw a map of United…
Read more…
2
Jamel Saadaoui
in
The Stata Gallery
Mar 4
Exporting Descriptive Statistics to Excel with Stata
Read more…
1