A picture is worth a thousand words.
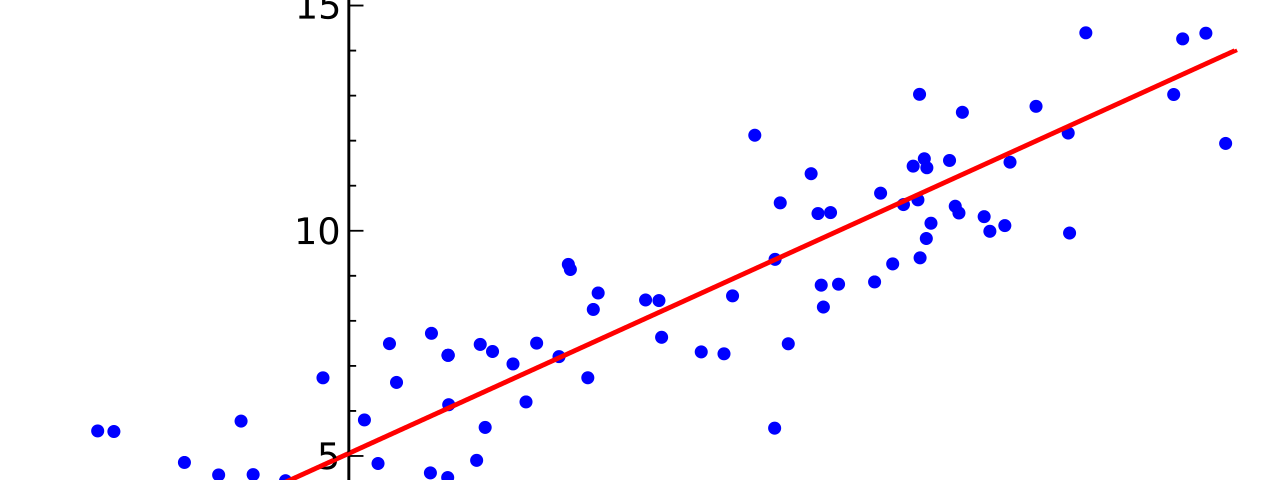
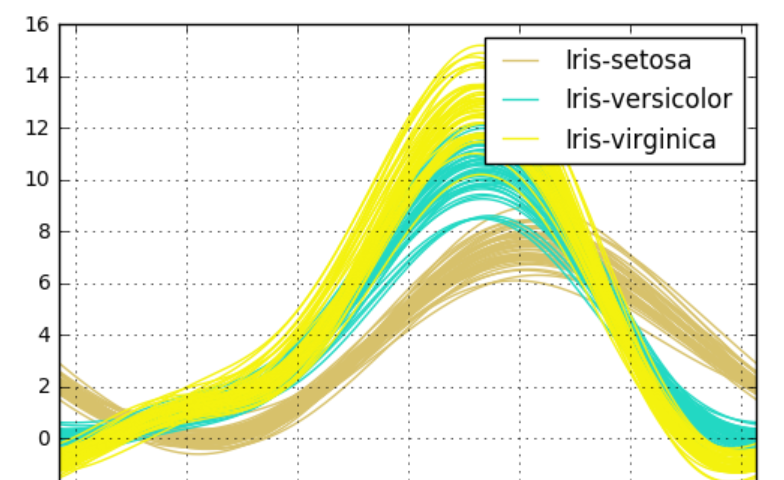
In the previous post, we saw some basic visualization techniques using pandas and matplotlib . With the same prerequisites, lets now delve into some advanced plotting techniques using the seaborn library.
pandas
matplotlib
seaborn
This is We are Orb newsletter and you are receiving this because you follow us on Medium. Thank you for your support ❤.
Here, Ken from Ghana explains what a blockchain is and shows you how to build one.
Pankajashree from India shows us how to visualize USA’s air pollution dataset to have a big picture of the differences in the…