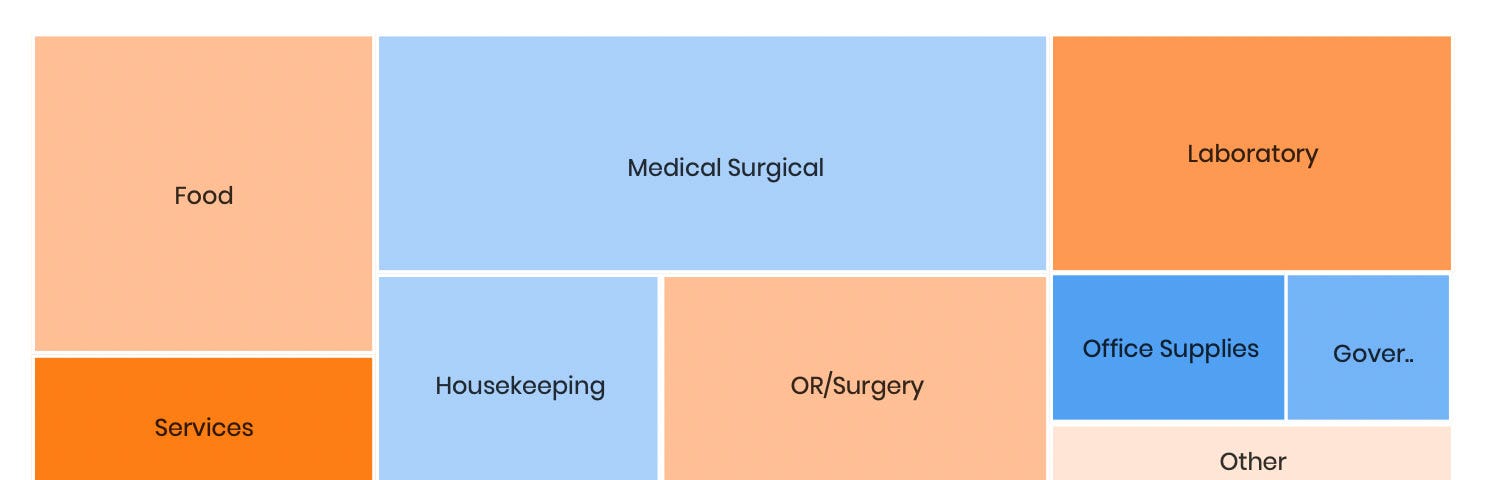
The following heat map displays how value of spend for certain categories changed over two period of times.
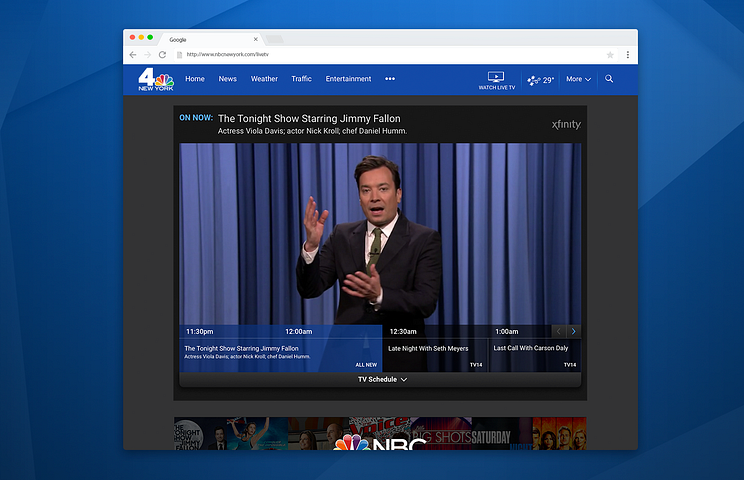
Business goal: Keep users engaged with video content and solve partnership and promotion opportunities.
Responsible for: Visual Design • UI • Screener Questionnaire • User Test Questions
NBC’s local news stations didn’t have a way for their audience to watch Live TV within their own products. The business goal was to keep…
Responsible for: Visual Design • UX • Prototyping
In uncertain times, quarantines may be necessary to stop the spread of lethal virus’s. In an effort to reopen and maintain social distancing, gym’s have allowed members to schedule blocks of time to work out.
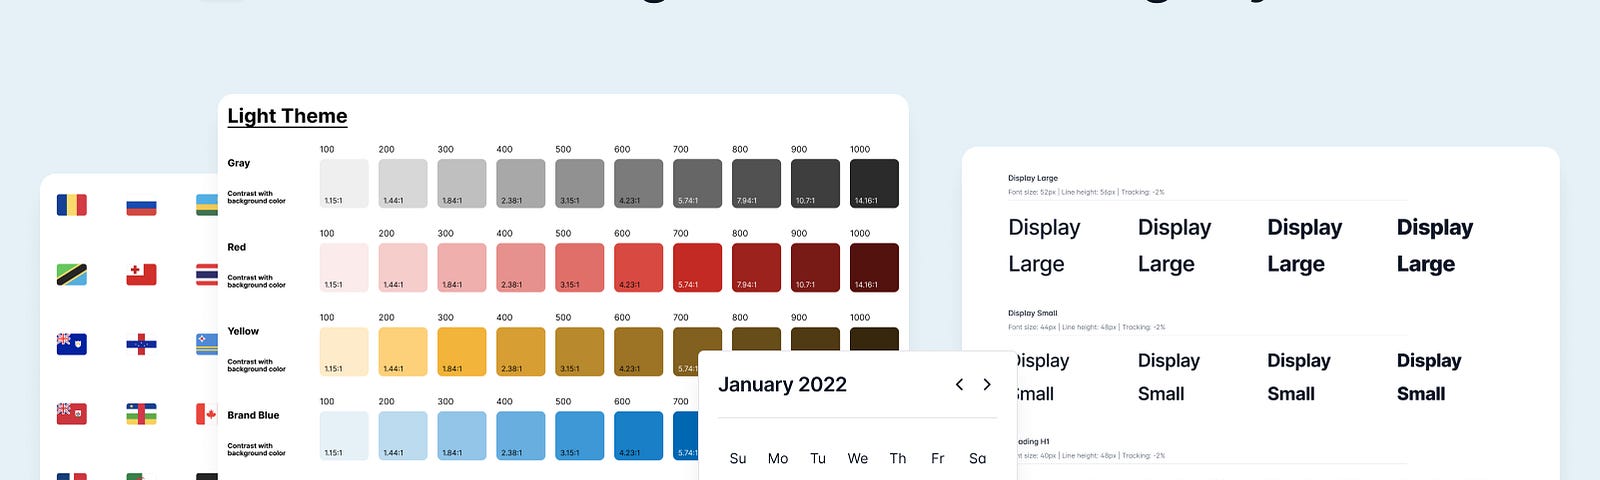
While there have been major design improvements to Gmail’s core interface, the settings page has gone untouched for over a decade…
On mobile web, users spend a lot of time viewing photo gallery pages but video views are what drive revenue. Stakeholders decided to add a video in each gallery page. Shortly after the change, engagement had dropped -99%.