Homepage
Open in app
Sign in
Get started
The Researchers’ Guide
Learn Everyday Something New
Welcome
Visualization
Machine Learning
Statistics
Research
Road Safety
Short Read
Follow
Latest
Trending
Rahul Raoniar
in
The Researchers’ Guide
Apr 13, 2023
Plotting Traffic Crash Trend using Python, Matplotlib, and Seaborn
Introduction
Read more…
11
1 response
Rahul Raoniar
in
The Researchers’ Guide
Apr 13, 2023
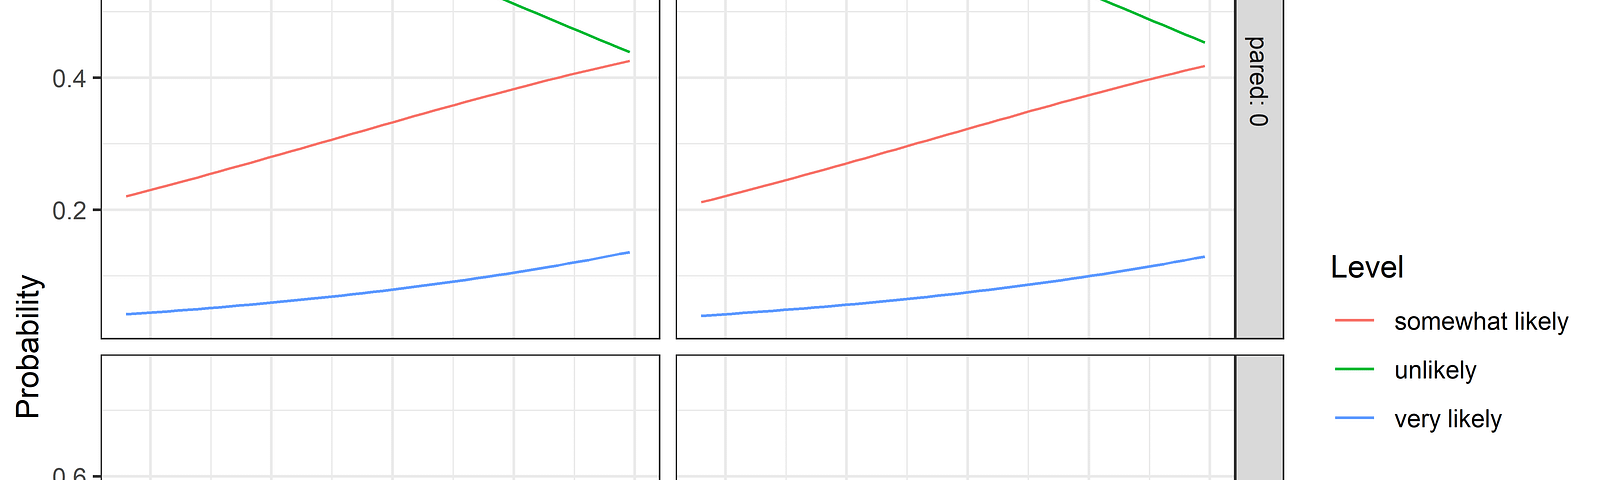
Ordered Logistic Regression in R (research-oriented modeling and interpretation)
Introduction
Read more…
12
Rahul Raoniar
in
The Researchers’ Guide
Sep 4, 2022
Introduction to Box and Boxen Plots — Matplotlib, Pandas and Seaborn Visualization Guide (Part 3)
Read more…
265
Rahul Raoniar
in
The Researchers’ Guide
Aug 31, 2022
Introduction to Dodged Bar Plot (with Numerical Stats)— Python Visualization Guide (Part 2.3)
Read more…
255
Rahul Raoniar
in
The Researchers’ Guide
Aug 3, 2022
Introduction to Stacked Bar Plot — Matplotlib, Pandas and Seaborn Visualization Guide (Part 2.2)
Read more…
343
Rahul Raoniar
in
The Researchers’ Guide
Jul 3, 2022
Introduction to Dodged Bar Plot — Matplotlib, Pandas and Seaborn Visualization Guide (Part 2.1)
Read more…
225
Rahul Raoniar
in
The Researchers’ Guide
Jun 14, 2022
Introduction to Line Plot — Matplotlib, Pandas and Seaborn Visualization Guide (Part 1)
Read more…
119
Rahul Raoniar
in
The Researchers’ Guide
May 5, 2022
Generate Numerical Correlation and Nominal Association Plots using Python
Correlation and Association…
Read more…
70
Rahul Raoniar
in
The Researchers’ Guide
Apr 4, 2022
How to Set up Python and Visual Studio Code IDE for Data Science
Read more…
85
Rahul Raoniar
in
The Researchers’ Guide
Mar 26, 2022
Start Your Data Science Journey with these Books and Courses
Read more…
341
2 responses
About
The Researchers’ Guide
A Friendly Place for Educators & Researchers to Learn Applied Data Science, ML & Statistics
More information
Followers
79
Elsewhere