Homepage
Open in app
Sign in
Get started
The Researchers’ Guide
Learn Everyday Something New
Welcome
Visualization
Machine Learning
Statistics
Research
Road Safety
Short Read
Follow
Latest
Trending
Rahul Raoniar
in
The Researchers’ Guide
Jun 6, 2021
Finding the Best Distribution that Fits Your Data using Python’s Fitter Library
Learn how to identify…
Read more…
720
18 responses
Rahul Raoniar
in
The Researchers’ Guide
Oct 28, 2021
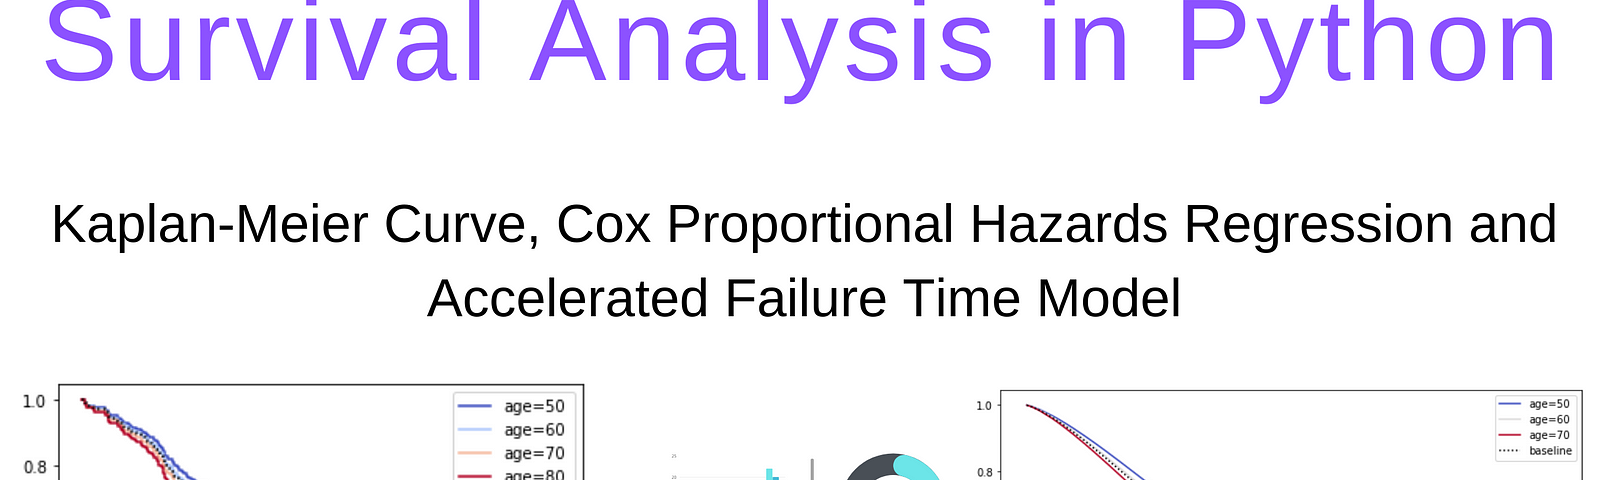
Survival Analysis in Python (KM Estimate, Cox-PH and AFT Model)
Learn Survival Analysis (Time to Event…
Read more…
287
6 responses
Rahul Raoniar
in
The Researchers’ Guide
Sep 4, 2022
Introduction to Box and Boxen Plots — Matplotlib, Pandas and Seaborn Visualization Guide (Part 3)
Read more…
265
Rahul Raoniar
in
The Researchers’ Guide
Apr 4, 2022
How to Set up Python and Visual Studio Code IDE for Data Science
Read more…
85
Rahul Raoniar
in
The Researchers’ Guide
Jun 14, 2022
Introduction to Line Plot — Matplotlib, Pandas and Seaborn Visualization Guide (Part 1)
Read more…
119
Rahul Raoniar
in
The Researchers’ Guide
Mar 30, 2020
Make Your Data Manipulation Fast, Fluent, and Fun Using the dfply Package in Python
Read more…
147
Rahul Raoniar
in
The Researchers’ Guide
Aug 25, 2020
Modelling Multiple Linear Regression Using R (research-oriented modelling and interpretation)
Read more…
55
Rahul Raoniar
in
The Researchers’ Guide
Aug 6, 2020
Setting Up IPython Notebook using Anaconda Distribution
Anaconda environment setup and connecting it…
Read more…
3
Rahul Raoniar
in
The Researchers’ Guide
Jul 6, 2020
How to Generate ECDF Plot using Python and R
Empirical Cumulative Distribution Function (ECDF)…
Read more…
52
Rahul Raoniar
in
The Researchers’ Guide
Mar 26, 2022
Start Your Data Science Journey with these Books and Courses
Read more…
341
2 responses
About
The Researchers’ Guide
A Friendly Place for Educators & Researchers to Learn Applied Data Science, ML & Statistics
More information
Followers
79
Elsewhere