Homepage
Open in app
The Stata Guide
Sign in
Get started
Top Stories published by The Stata Guide in October of 2020
All
2020
October
Sort by most read
Asjad Naqvi
in
The Stata Guide
Oct 30, 2020
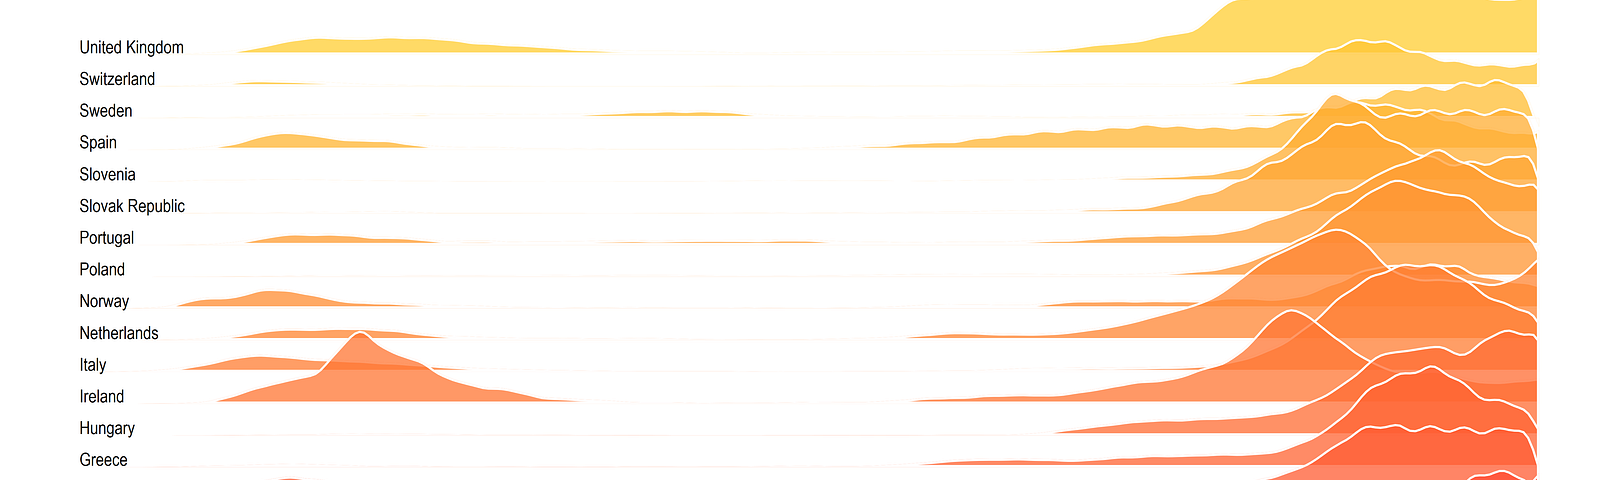
COVID-19 visualizations with Stata Part 8: Ridgeline plots (Joy plots)
Read more…
12
Asjad Naqvi
in
The Stata Guide
Oct 1, 2020
Automating Eurostat in Stata
Learn how to automate Eurostat datasets in Stata by reading and cleaning…
Read more…
10
1 response
Asjad Naqvi
in
The Stata Guide
Oct 10, 2020
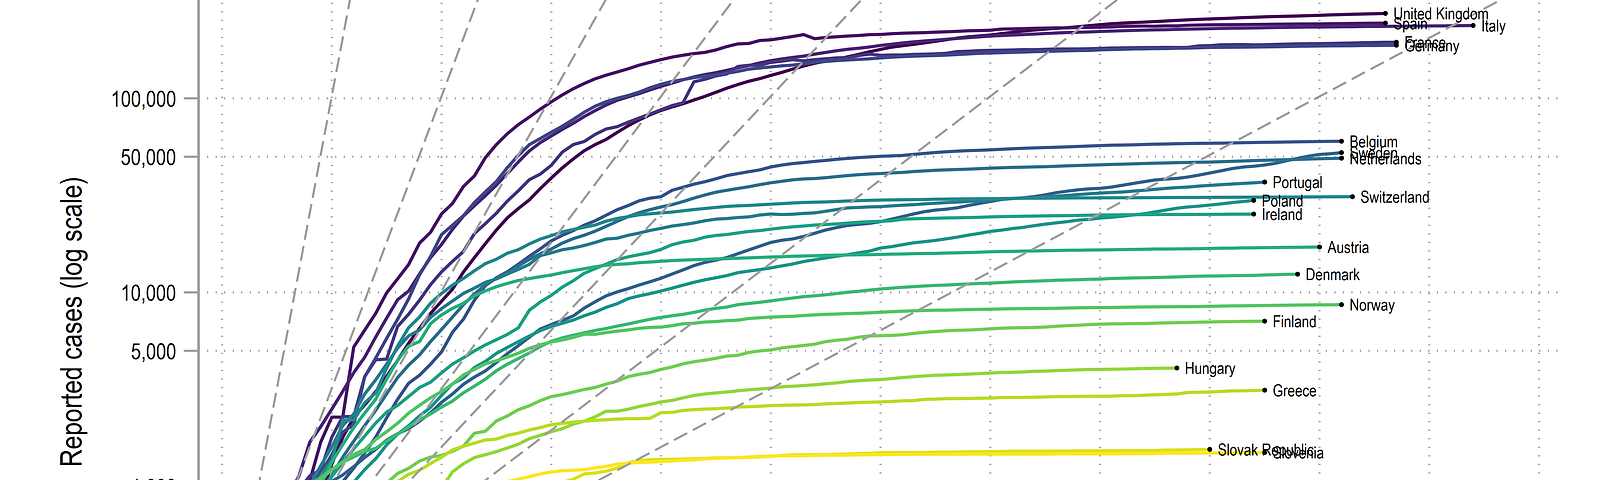
COVID-19 visualizations with Stata Part 7: Doubling time graphs
In this guide we will learn how to make the following doubling time graph in
Stata:
Read more…
1
September 2020
November 2020
About
The Stata Guide
Here we showcase a series of articles on the Stata software covering topics ranging from data science to statistical analysis.
More information
Tags
Derivation
Data Visualization
Covid-19
Doubling Time
Stata
Workflow
Automation
Eurostat
Stata
Covid-19
Editors
Asjad Naqvi
Writers
Asjad Naqvi
Fahad Mirza