Homepage
Open in app
The Stata Guide
Sign in
Get started
Top Stories published by The Stata Guide in September of 2020
All
2020
September
Sort by most read
Asjad Naqvi
in
The Stata Guide
Sep 7, 2020
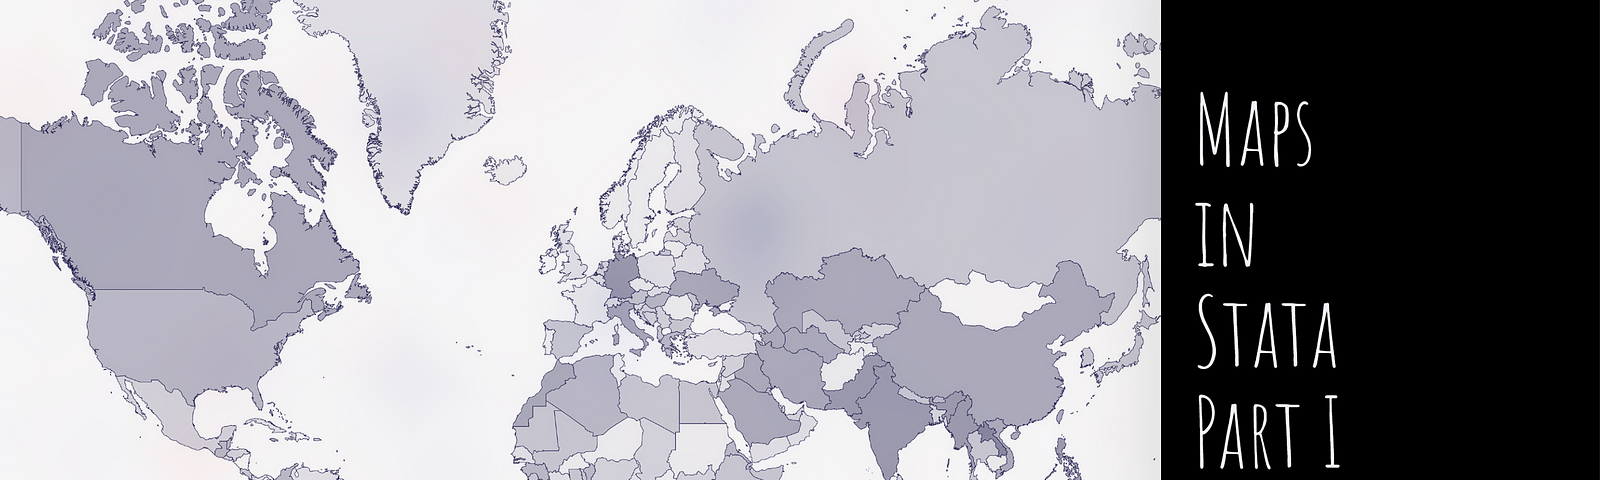
Maps in Stata — Part 1
Learn how to make maps in Stata. In this guide we will learn how to pull data…
Read more…
32
2 responses
Asjad Naqvi
in
The Stata Guide
Sep 2, 2020
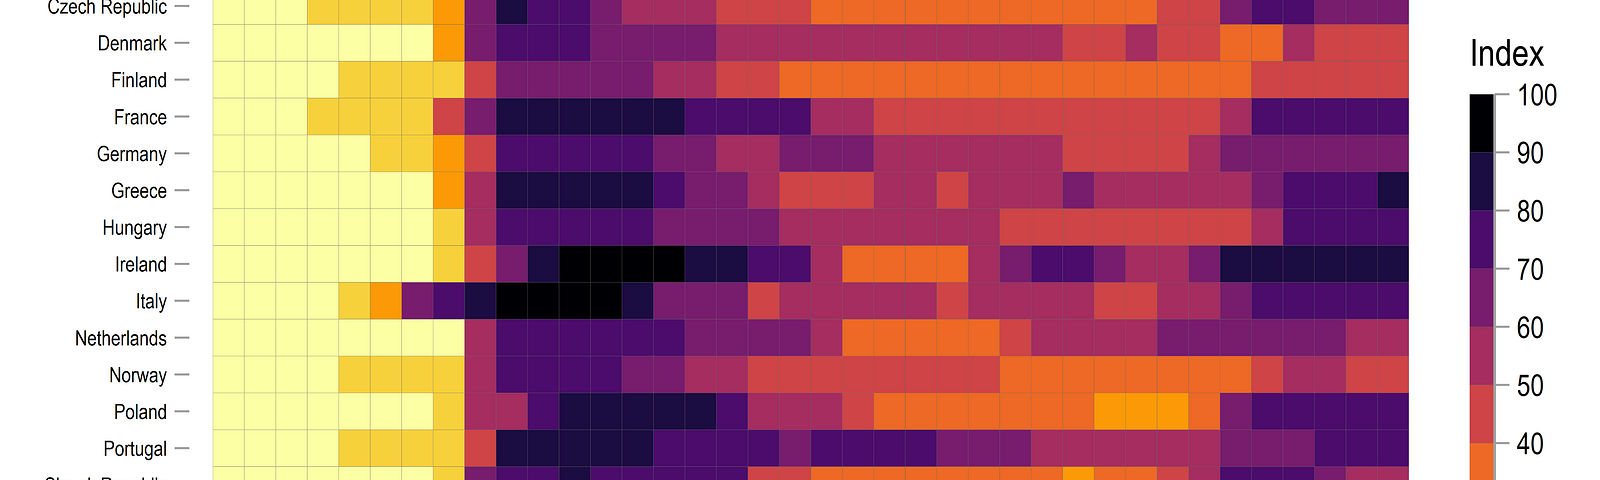
COVID-19 visualizations with Stata Part 3: Heatplots
Read more…
15
1 response
Asjad Naqvi
in
The Stata Guide
Sep 16, 2020
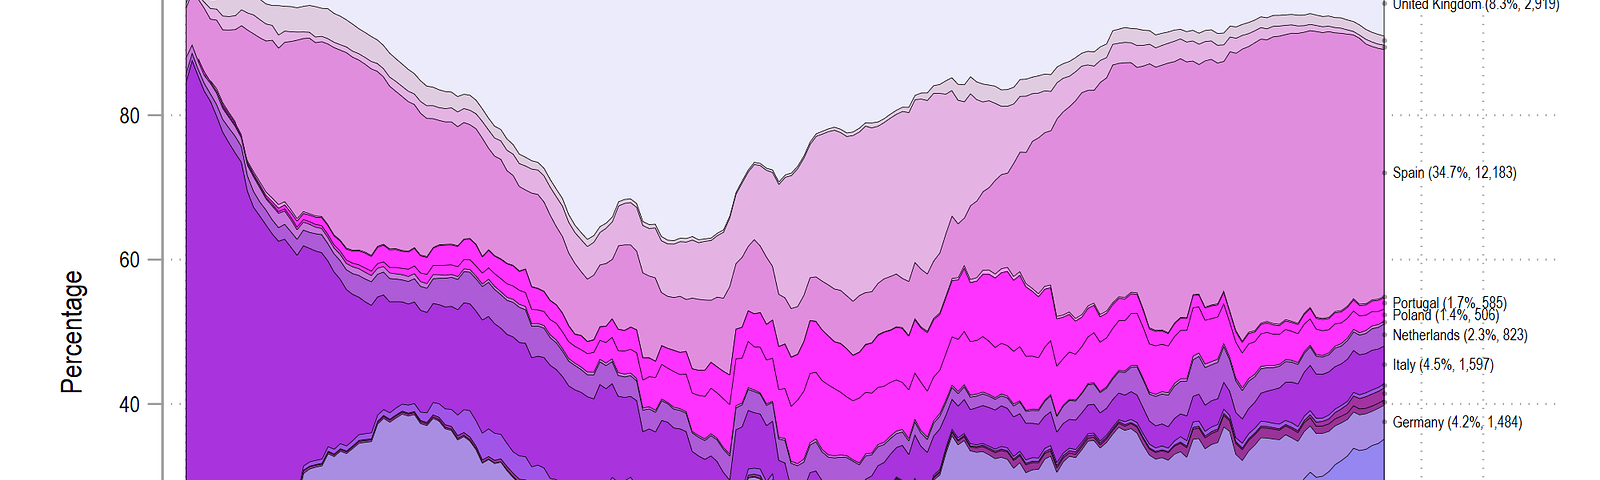
COVID-19 visualizations with Stata Part 5: Stacked area graphs
Read more…
4
Asjad Naqvi
in
The Stata Guide
Sep 22, 2020
COVID-19 visualizations with Stata Part 6: Animations
Read more…
5
August 2020
October 2020
About
The Stata Guide
Here we showcase a series of articles on the Stata software covering topics ranging from data science to statistical analysis.
More information
Tags
Maps
Covid-19
Color Scheme
Animation
Stata
Automation
Visualization
Covid-19
Graphs
Stata
Editors
Asjad Naqvi
Writers
Asjad Naqvi
Fahad Mirza