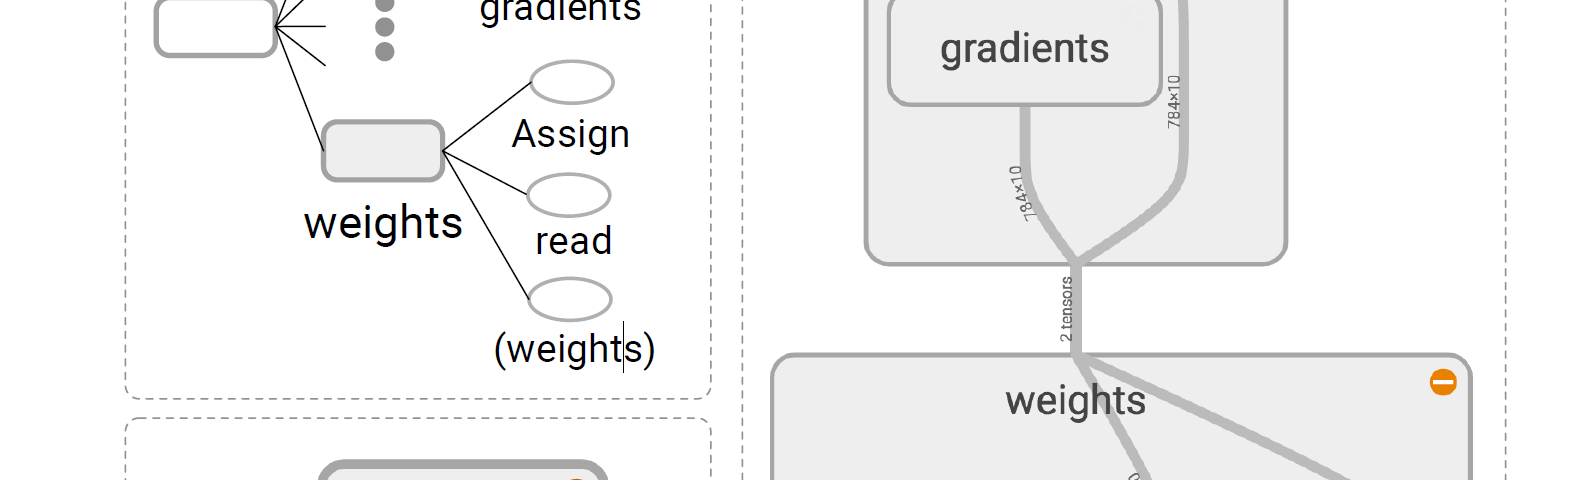
How an interactive graph visualization made all the difference for deep learning…
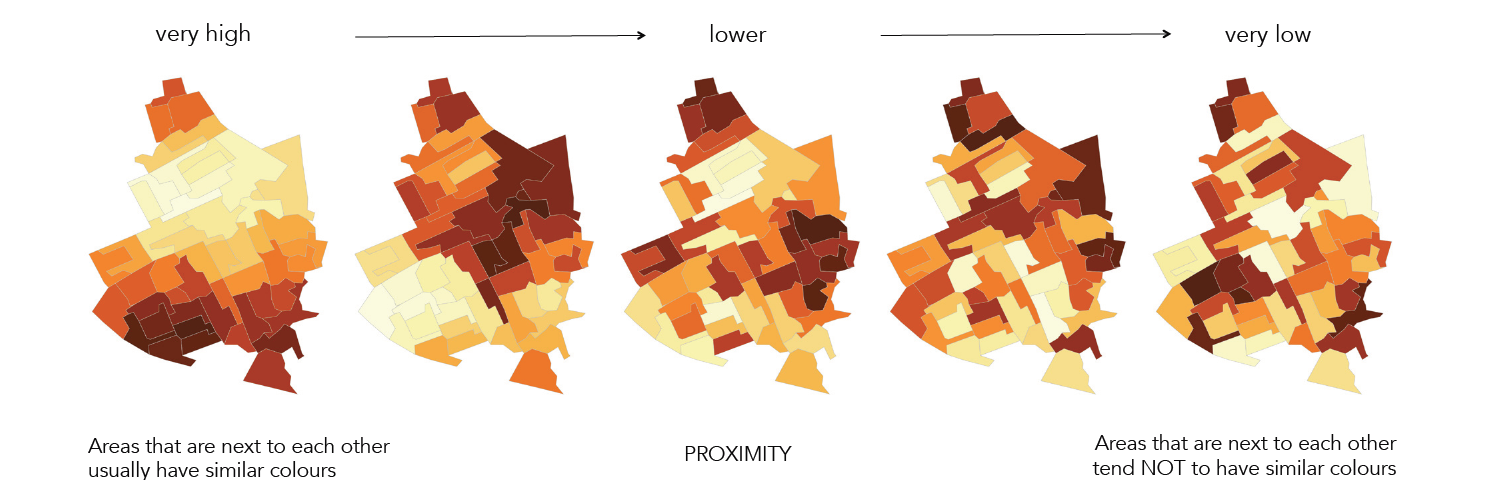
Spatial representations can help us perceive geographical phenomena.
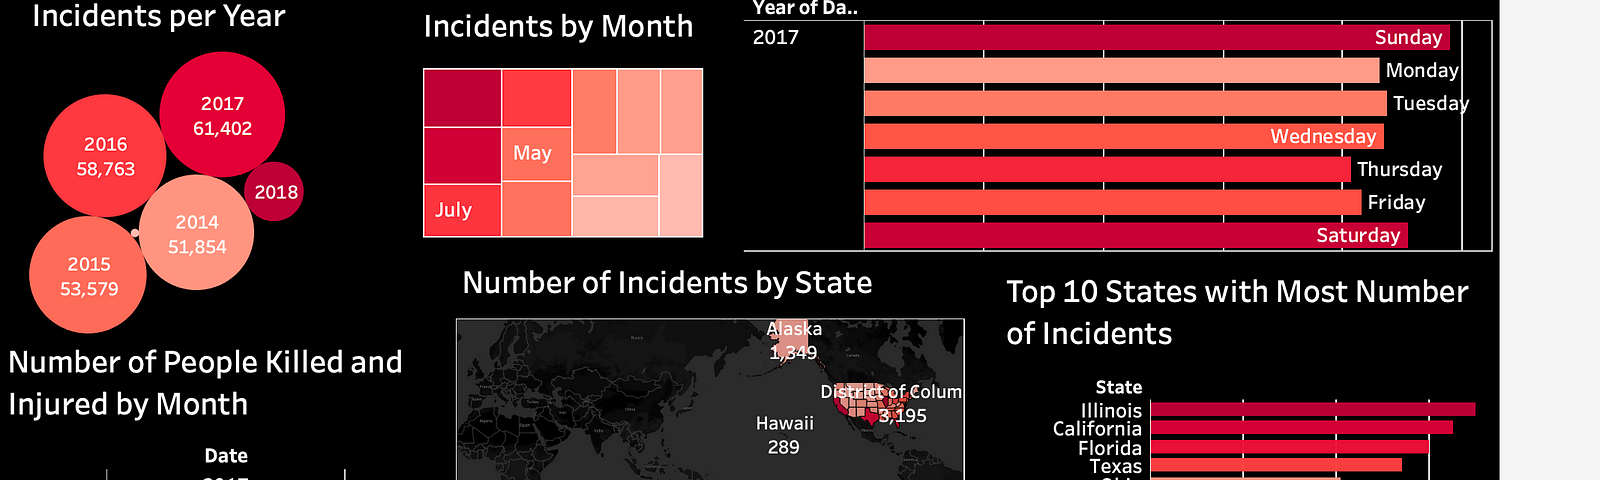
How data can offer insight into a complex societal issue.
Can you visualize stand-up comedy?
Creating a tool to help doctors predict diabetes adherence in patients.
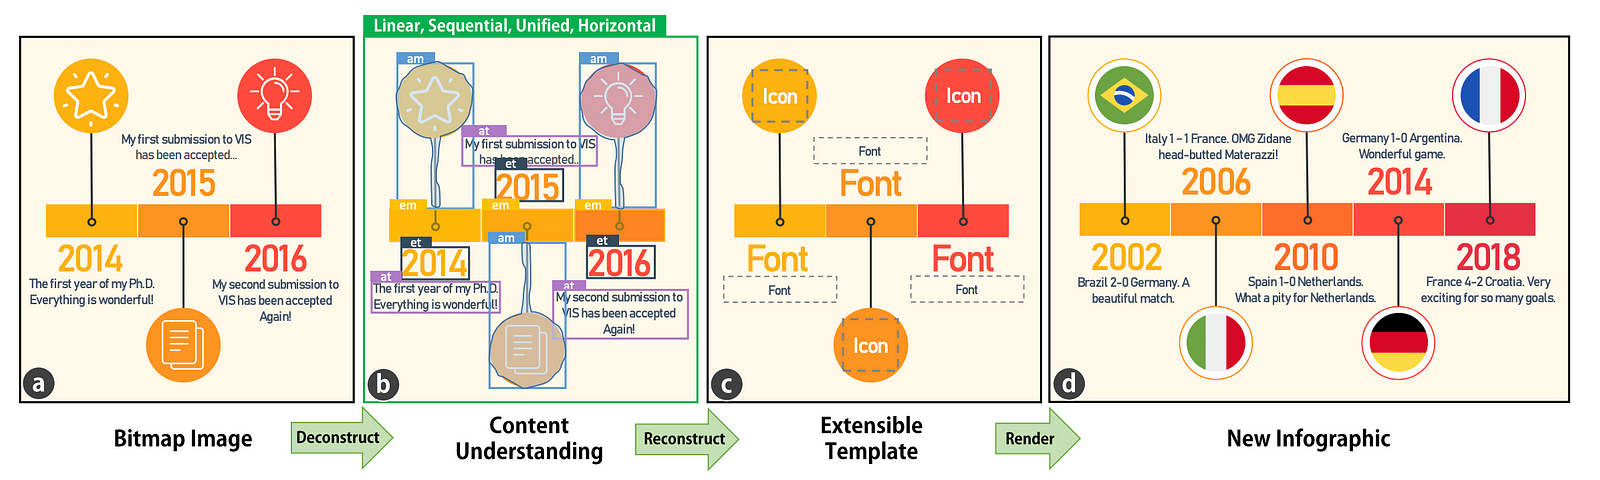
How artificial intelligence can improve your visual design skills.
These were the top 10 stories published by VisUMD; you can also dive into yearly archives: 2019, 2020, 2021, 2022, and 2023.